

10 Probabilistic Exposure Assessment to Phycotoxins by Recreational. . .
125
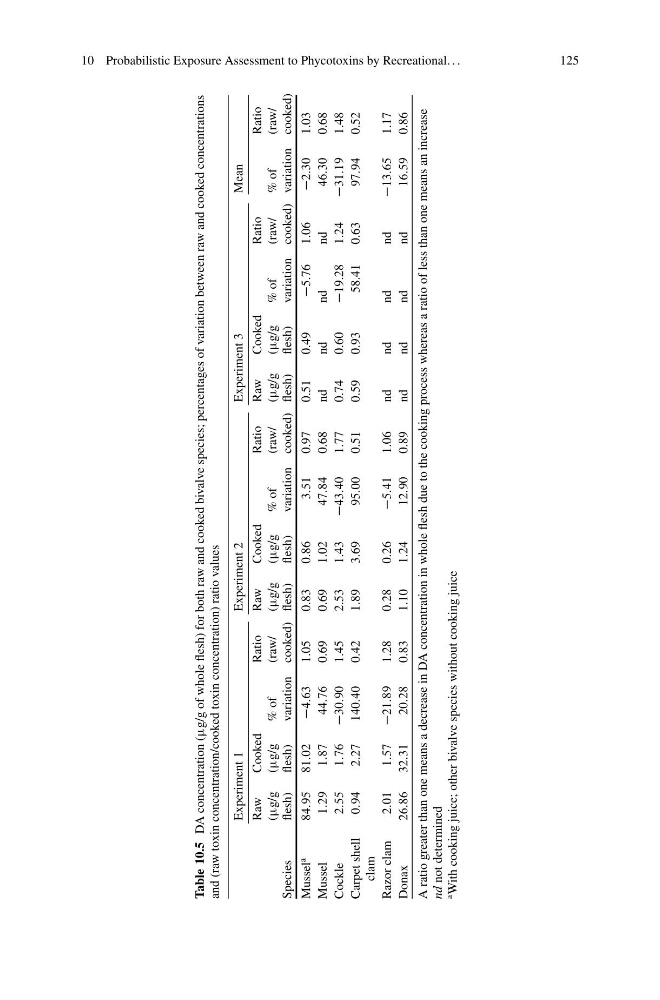
Table 10.5
DA concentration (g/g of whole flesh) for both raw and cooked bivalve species; percentages of variation between raw and cooked concentrations
and (raw toxin concentration/cooked toxin concentration) ratio values
Experiment 1
Experiment 2
Experiment 3
Mean
Species
Raw
(g/g
flesh)
Cooked
(g/g
flesh)
% of
variation
Ratio
(raw/
cooked)
Raw
(g/g
flesh)
Cooked
(g/g
flesh)
% of
variation
Ratio
(raw/
cooked)
Raw
(g/g
flesh)
Cooked
(g/g
flesh)
% of
variation
Ratio
(raw/
cooked)
% of
variation
Ratio
(raw/
cooked)
Mussel
a
84:95 81:02
4:63
1.05
0.83
0.86
3:51
0.97
0.51
0.49
5.76
1.06
2:30
1.03
Mussel
1:29
1:87
44:76
0.69
0.69
1.02
47:84
0.68
nd
nd
nd
nd
46:30
0.68
Cockle
2:55
1:76 30:90
1.45
2.53
1.43
43:40
1.77
0.74
0.60
19.28
1.24
31:19
1.48
Carpet shell
clam
0:94
2:27
140:40
0.42
1.89
3.69
95:00
0.51
0.59
0.93
58.41
0.63
97:94
0.52
Razor clam
2:01
1:57 21:89
1.28
0.28
0.26
5:41
1.06
nd
nd
nd
nd
13:65
1.17
Donax
26:86 32:31
20:28
0.83
1.10
1.24
12:90
0.89
nd
nd
nd
nd
16:59
0.86
A ratio greater than one means a decrease in DA concentration in whole flesh due to the cooking process whereas a ratio of less than one means an increase
nd
not determined
a
With cooking juice; other bivalve species without cooking juice
125
Table 10.5
DA concentration (g/g of whole flesh) for both raw and cooked bivalve species; percentages of variation between raw and cooked concentrations
and (raw toxin concentration/cooked toxin concentration) ratio values
Experiment 1
Experiment 2
Experiment 3
Mean
Species
Raw
(g/g
flesh)
Cooked
(g/g
flesh)
% of
variation
Ratio
(raw/
cooked)
Raw
(g/g
flesh)
Cooked
(g/g
flesh)
% of
variation
Ratio
(raw/
cooked)
Raw
(g/g
flesh)
Cooked
(g/g
flesh)
% of
variation
Ratio
(raw/
cooked)
% of
variation
Ratio
(raw/
cooked)
Mussel
a
84:95 81:02
4:63
1.05
0.83
0.86
3:51
0.97
0.51
0.49
5.76
1.06
2:30
1.03
Mussel
1:29
1:87
44:76
0.69
0.69
1.02
47:84
0.68
nd
nd
nd
nd
46:30
0.68
Cockle
2:55
1:76 30:90
1.45
2.53
1.43
43:40
1.77
0.74
0.60
19.28
1.24
31:19
1.48
Carpet shell
clam
0:94
2:27
140:40
0.42
1.89
3.69
95:00
0.51
0.59
0.93
58.41
0.63
97:94
0.52
Razor clam
2:01
1:57 21:89
1.28
0.28
0.26
5:41
1.06
nd
nd
nd
nd
13:65
1.17
Donax
26:86 32:31
20:28
0.83
1.10
1.24
12:90
0.89
nd
nd
nd
nd
16:59
0.86
A ratio greater than one means a decrease in DA concentration in whole flesh due to the cooking process whereas a ratio of less than one means an increase
nd
not determined
a
With cooking juice; other bivalve species without cooking juice