

Phytoplankton growth model parametrization
41
Maximum Growth Rate (p'? Several workers (Sommer 1983; Reynolds
1989) have reported that plankton algae conform to the general allometric
relationships between size and growth rate (e.g., Blueweiss et al. 1978;
Peters 1983), in that small-celled species are found to be able to grow faster
than large-celled ones. On the other hand, both Banse (1982) and Furnas
(1990) point out that there is also important variation related to the
morphological features of the major taxonomic groups; marine diatoms
have significantly higher growth rates than would be expected from their
size, while the reverse seems to be true for marine dinoflagellates. Within
both of these groups, there are only weak relationships between size and
growth rate (Banse 1982).
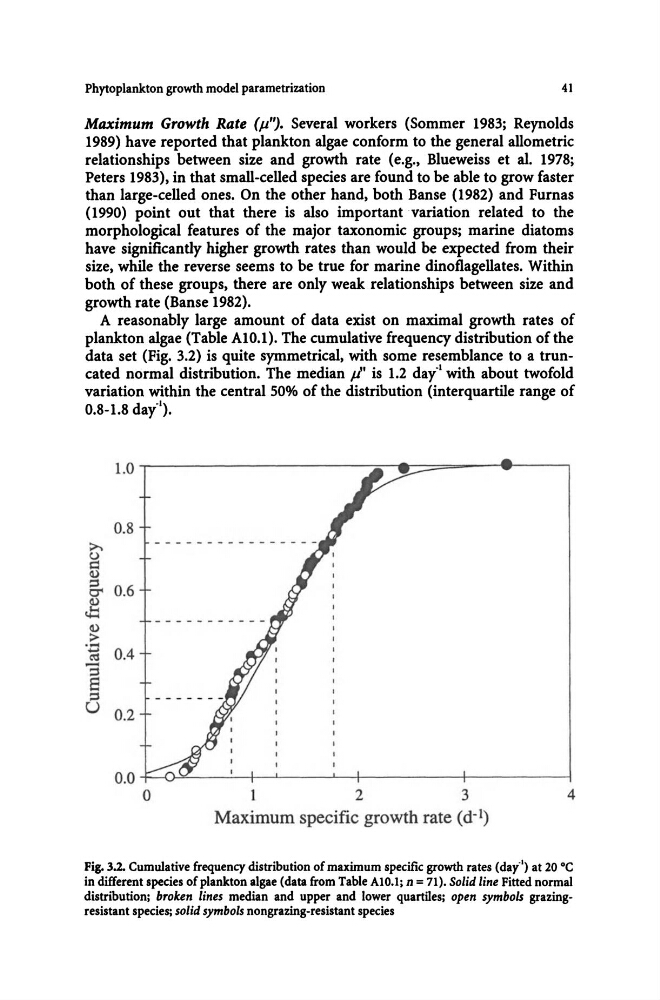
A reasonably large amount of data exist on maximal growth rates of
plankton algae (Table AI0.l). The cumulative frequency distribution of the
data set (Fig. 3.2) is quite symmetrical, with some resemblance to a truncated normal distribution. The median fl' is 1.2 day"' with about twofold
variation within the central 50% of the distribution (interquarti1e range of
0.8-1.8 day"').
1.0 - , - - - - -- -------:;.---a_===----1..-------,
0.8
>u
~
G.)
:s 0.6
C'"
G.)
..t:::
- - - - - - - - - - -
G.)
>
.- ..... 0.4
C' :S
-: s
S
:s
U 0.2
0.0 -f-~.<:...---'--+_-'----'L---+------t__----i
o
2
3
4
Maximum specific growth rate (d- I )
Fig. 3.2. Cumulative frequency distribution of maximum specific growth rates (day") at 20 °c
in different species of plankton algae (data from Table AIO.I; n = 71). Solid line Fitted normal
distribution; broken lines median and upper and lower quartiles; open symbols grazingresistant species; solid symbols nongrazing-resistant species
41
Maximum Growth Rate (p'? Several workers (Sommer 1983; Reynolds
1989) have reported that plankton algae conform to the general allometric
relationships between size and growth rate (e.g., Blueweiss et al. 1978;
Peters 1983), in that small-celled species are found to be able to grow faster
than large-celled ones. On the other hand, both Banse (1982) and Furnas
(1990) point out that there is also important variation related to the
morphological features of the major taxonomic groups; marine diatoms
have significantly higher growth rates than would be expected from their
size, while the reverse seems to be true for marine dinoflagellates. Within
both of these groups, there are only weak relationships between size and
growth rate (Banse 1982).
A reasonably large amount of data exist on maximal growth rates of
plankton algae (Table AI0.l). The cumulative frequency distribution of the
data set (Fig. 3.2) is quite symmetrical, with some resemblance to a truncated normal distribution. The median fl' is 1.2 day"' with about twofold
variation within the central 50% of the distribution (interquarti1e range of
0.8-1.8 day"').
1.0 - , - - - - -- -------:;.---a_===----1..-------,
0.8
>u
~
G.)
:s 0.6
C'"
G.)
..t:::
- - - - - - - - - - -
G.)
>
.- ..... 0.4
C' :S
-: s
S
:s
U 0.2
0.0 -f-~.<:...---'--+_-'----'L---+------t__----i
o
2
3
4
Maximum specific growth rate (d- I )
Fig. 3.2. Cumulative frequency distribution of maximum specific growth rates (day") at 20 °c
in different species of plankton algae (data from Table AIO.I; n = 71). Solid line Fitted normal
distribution; broken lines median and upper and lower quartiles; open symbols grazingresistant species; solid symbols nongrazing-resistant species