

24
The Biogeochemical Theatre - Phosphorus Cycling and Phosphorus Household in Lakes
1.0
Zoo•
plankton
0.8
P
~
u
Phyto~
0.6
d)
plankton
=='
0"
P
d)
~
d)
0.4
>
..... ....
c<:S
...-.
=='
8 0.2
=='
U
o.o~~ __ ~+-____ ~~ ____ ~ ______ -+ ______ ~
0.0
0.2
0.4
0.6
0.8
1.0
Fraction of particulate phosphorus
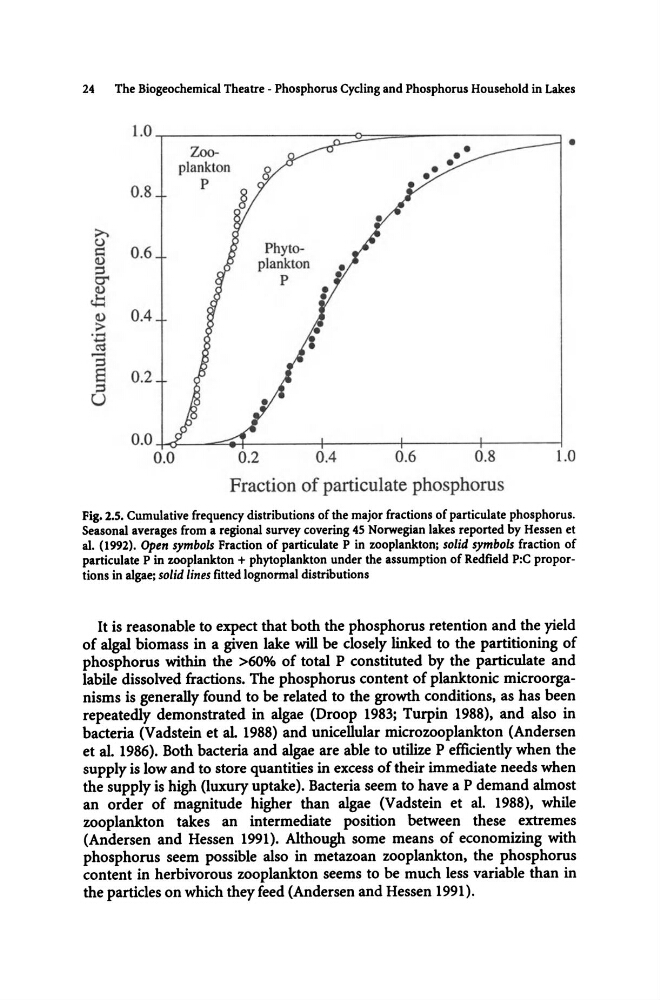
Fig. 2.5. Cumulative frequency distributions of the major fractions of particulate phosphorus.
Seasonal averages from a regional survey covering 45 Norwegian lakes reported by Hessen et
aI. (1992). Open symbols Fraction of particulate P in zooplankton; solid symbols fraction of
particulate P in zooplankton + phytoplankton under the assumption of Redfield P:C proportions in algae; solid lines fitted lognormal distributions
It is reasonable to expect that both the phosphorus retention and the yield
of algal biomass in a given lake will be closely linked to the partitioning of
phosphorus within the >60% of total P constituted by the particulate and
labile dissolved fractions. The phosphorus content of planktonic microorganisms is generally found to be related to the growth conditions, as has been
repeatedly demonstrated in algae (Droop 1983; Turpin 1988), and also in
bacteria (Vadstein et al. 1988) and unicellular microzooplankton (Andersen
et al. 1986). Both bacteria and algae are able to utilize P efficiently when the
supply is low and to store quantities in excess of their immediate needs when
the supply is high (luxury uptake). Bacteria seem to have a P demand almost
an order of magnitude higher than algae (Vadstein et al. 1988), while
zooplankton takes an intermediate position between these extremes
(Andersen and Hessen 1991). Although some means of economizing with
phosphorus seem possible also in metazoan zooplankton, the phosphorus
content in herbivorous zooplankton seems to be much less variable than in
the particles on which they feed (Andersen and Hessen 1991).
The Biogeochemical Theatre - Phosphorus Cycling and Phosphorus Household in Lakes
1.0
Zoo•
plankton
0.8
P
~
u
Phyto~
0.6
d)
plankton
=='
0"
P
d)
~
d)
0.4
>
..... ....
c<:S
...-.
=='
8 0.2
=='
U
o.o~~ __ ~+-____ ~~ ____ ~ ______ -+ ______ ~
0.0
0.2
0.4
0.6
0.8
1.0
Fraction of particulate phosphorus
Fig. 2.5. Cumulative frequency distributions of the major fractions of particulate phosphorus.
Seasonal averages from a regional survey covering 45 Norwegian lakes reported by Hessen et
aI. (1992). Open symbols Fraction of particulate P in zooplankton; solid symbols fraction of
particulate P in zooplankton + phytoplankton under the assumption of Redfield P:C proportions in algae; solid lines fitted lognormal distributions
It is reasonable to expect that both the phosphorus retention and the yield
of algal biomass in a given lake will be closely linked to the partitioning of
phosphorus within the >60% of total P constituted by the particulate and
labile dissolved fractions. The phosphorus content of planktonic microorganisms is generally found to be related to the growth conditions, as has been
repeatedly demonstrated in algae (Droop 1983; Turpin 1988), and also in
bacteria (Vadstein et al. 1988) and unicellular microzooplankton (Andersen
et al. 1986). Both bacteria and algae are able to utilize P efficiently when the
supply is low and to store quantities in excess of their immediate needs when
the supply is high (luxury uptake). Bacteria seem to have a P demand almost
an order of magnitude higher than algae (Vadstein et al. 1988), while
zooplankton takes an intermediate position between these extremes
(Andersen and Hessen 1991). Although some means of economizing with
phosphorus seem possible also in metazoan zooplankton, the phosphorus
content in herbivorous zooplankton seems to be much less variable than in
the particles on which they feed (Andersen and Hessen 1991).