

22
The Biogeochemical Theatre - Phosphorus Cycling and Phosphorus Household in Lakes
100
---I-t
d)
.....
.....
- ~
b£)
:::t
10
'-'
~
::::=
>.
..c::
0..
0
I-t
0
- ..c::
U
•
1
: .
•
10
•
•••
• •
•
•
• •
•
•
100
Total phosphorus (~g P liter -I)
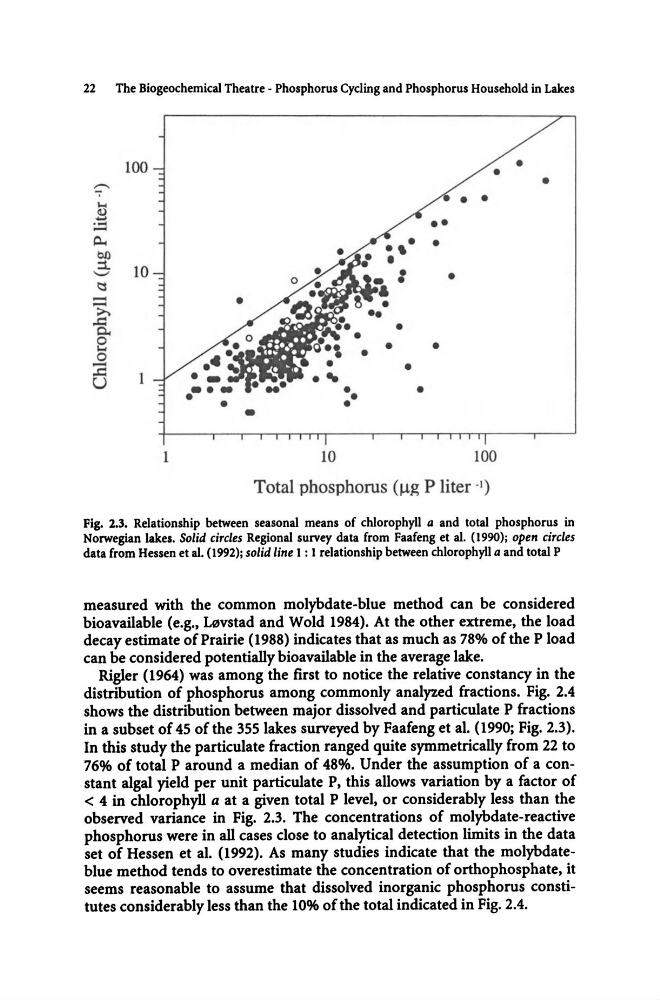
Fig. 2.3. Relationship between seasonal means of chlorophyll a and total phosphorus in
Norwegian lakes. Solid circles Regional survey data from Faafeng et a!. (1990); open circles
data from Hessen et al. (1992); solid line 1 : 1 relationship between chlorophyll a and total P
measured with the common molybdate-blue method can be considered
bioavailable (e.g., L0vstad and Wold 1984). At the other extreme, the load
decay estimate of Prairie (1988) indicates that as much as 78% of the P load
can be considered potentially bioavailable in the average lake.
Rigler (1964) was among the first to notice the relative constancy in the
distribution of phosphorus among commonly analyzed fractions. Fig. 2.4
shows the distribution between major dissolved and particulate P fractions
in a subset of 45 of the 355 lakes surveyed by Faafeng et al. (1990; Fig. 2.3).
In this study the particulate fraction ranged quite symmetrically from 22 to
76% of total P around a median of 48%. Under the assumption of a constant algal yield per unit particulate P, this allows variation by a factor of
< 4 in chlorophyll a at a given total P level, or considerably less than the
observed variance in Fig. 2.3. The concentrations of molybdate-reactive
phosphorus were in all cases close to analytical detection limits in the data
set of Hessen et al. (1992). As many studies indicate that the molybdateblue method tends to overestimate the concentration of orthophosphate, it
seems reasonable to assume that dissolved inorganic phosphorus constitutes considerably less than the 10% of the total indicated in Fig. 2.4.
The Biogeochemical Theatre - Phosphorus Cycling and Phosphorus Household in Lakes
100
---I-t
d)
.....
.....
- ~
b£)
:::t
10
'-'
~
::::=
>.
..c::
0..
0
I-t
0
- ..c::
U
•
1
: .
•
10
•
•••
• •
•
•
• •
•
•
100
Total phosphorus (~g P liter -I)
Fig. 2.3. Relationship between seasonal means of chlorophyll a and total phosphorus in
Norwegian lakes. Solid circles Regional survey data from Faafeng et a!. (1990); open circles
data from Hessen et al. (1992); solid line 1 : 1 relationship between chlorophyll a and total P
measured with the common molybdate-blue method can be considered
bioavailable (e.g., L0vstad and Wold 1984). At the other extreme, the load
decay estimate of Prairie (1988) indicates that as much as 78% of the P load
can be considered potentially bioavailable in the average lake.
Rigler (1964) was among the first to notice the relative constancy in the
distribution of phosphorus among commonly analyzed fractions. Fig. 2.4
shows the distribution between major dissolved and particulate P fractions
in a subset of 45 of the 355 lakes surveyed by Faafeng et al. (1990; Fig. 2.3).
In this study the particulate fraction ranged quite symmetrically from 22 to
76% of total P around a median of 48%. Under the assumption of a constant algal yield per unit particulate P, this allows variation by a factor of
< 4 in chlorophyll a at a given total P level, or considerably less than the
observed variance in Fig. 2.3. The concentrations of molybdate-reactive
phosphorus were in all cases close to analytical detection limits in the data
set of Hessen et al. (1992). As many studies indicate that the molybdateblue method tends to overestimate the concentration of orthophosphate, it
seems reasonable to assume that dissolved inorganic phosphorus constitutes considerably less than the 10% of the total indicated in Fig. 2.4.