

Phosphorus Retention in Lakes
17
1.0 ""'1"::::::---"""'====: : - - - - - - - - - - - - - - - - ,
0.8
•
d
0
.....
~
d
0.6
0
~
..
0
1-0
•
en
•
2
• •
•
0
0.4
---..d
c.. en
0
•
..c:
~
0.2
•• •
• • •
•
•
0.0
10 ·5
10 ·4
10 ·3
10 ·2
10 .(
10°
Dilution rate (d -1 )
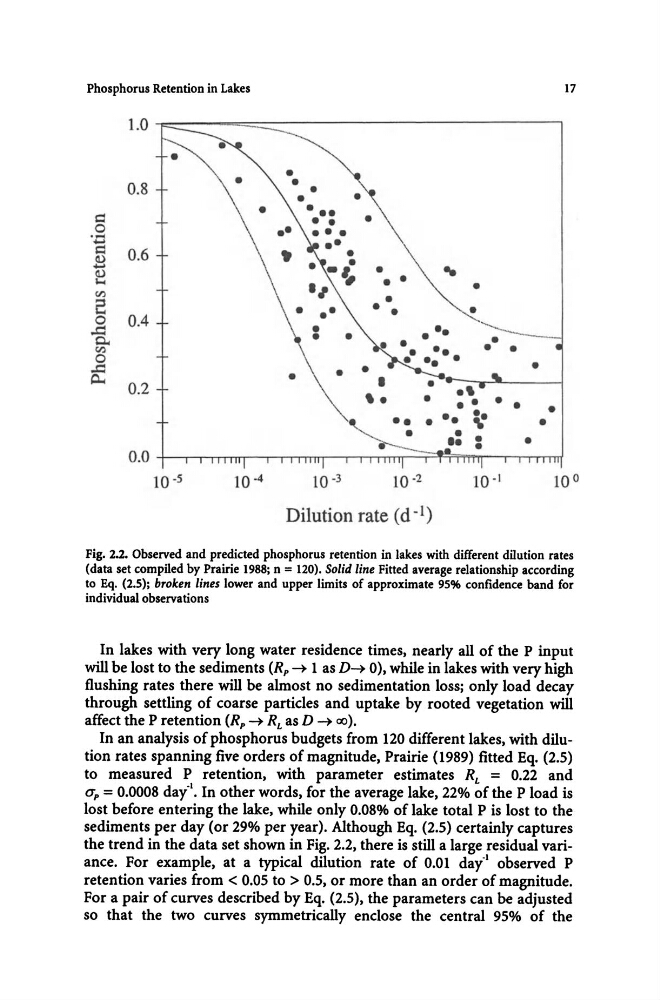
Fig. 2.2. Observed and predicted phosphorus retention in lakes with different dilution rates
(data set compiled by Prairie 1988; n = 120). Solid line Fitted average relationship according
to Eq. (2.5); broken lines lower and upper limits of approximate 95% confidence band for
individual observations
In lakes with very long water residence times, nearly all of the P input
will be lost to the sediments (Rp ~ 1 as D~ 0), while in lakes with very high
flushing rates there will be almost no sedimentation loss; only load decay
through settling of coarse particles and uptake by rooted vegetation will
affect the Pretention (Rp ~ RL as D ~ ex:».
In an analysis of phosphorus budgets from 120 different lakes, with dilution rates spanning five orders of magnitude, Prairie (1989) fitted Eq. (2.5)
to measured P retention, with parameter estimates RL = 0.22 and
O'p = 0.0008 day"l. In other words, for the average lake, 22% of the P load is
lost before entering the lake, while only 0.08% of lake total P is lost to the
sediments per day (or 29% per year). Although Eq. (2.5) certainly captures
the trend in the data set shown in Fig. 2.2, there is still a large residual variance. For example, at a typical dilution rate of 0.01 day"1 observed P
retention varies from < 0.05 to > 0.5, or more than an order of magnitude.
For a pair of curves described by Eq. (2.5), the parameters can be adjusted
so that the two curves symmetrically enclose the central 95% of the
17
1.0 ""'1"::::::---"""'====: : - - - - - - - - - - - - - - - - ,
0.8
•
d
0
.....
~
d
0.6
0
~
..
0
1-0
•
en
•
2
• •
•
0
0.4
---..d
c.. en
0
•
..c:
~
0.2
•• •
• • •
•
•
0.0
10 ·5
10 ·4
10 ·3
10 ·2
10 .(
10°
Dilution rate (d -1 )
Fig. 2.2. Observed and predicted phosphorus retention in lakes with different dilution rates
(data set compiled by Prairie 1988; n = 120). Solid line Fitted average relationship according
to Eq. (2.5); broken lines lower and upper limits of approximate 95% confidence band for
individual observations
In lakes with very long water residence times, nearly all of the P input
will be lost to the sediments (Rp ~ 1 as D~ 0), while in lakes with very high
flushing rates there will be almost no sedimentation loss; only load decay
through settling of coarse particles and uptake by rooted vegetation will
affect the Pretention (Rp ~ RL as D ~ ex:».
In an analysis of phosphorus budgets from 120 different lakes, with dilution rates spanning five orders of magnitude, Prairie (1989) fitted Eq. (2.5)
to measured P retention, with parameter estimates RL = 0.22 and
O'p = 0.0008 day"l. In other words, for the average lake, 22% of the P load is
lost before entering the lake, while only 0.08% of lake total P is lost to the
sediments per day (or 29% per year). Although Eq. (2.5) certainly captures
the trend in the data set shown in Fig. 2.2, there is still a large residual variance. For example, at a typical dilution rate of 0.01 day"1 observed P
retention varies from < 0.05 to > 0.5, or more than an order of magnitude.
For a pair of curves described by Eq. (2.5), the parameters can be adjusted
so that the two curves symmetrically enclose the central 95% of the