

196
Approaching Planktonic Food Webs: Competition, Coexistence, and Chaos
0.6
".......
,
'~
....
. -
......,
U
00 0.4
.s
' - '
c
0
.D
'C"O
U
'"0
0
.2
~
0.2
....
C"O
='
U
.~
P...
O.O~--.-----------------~------------------~
0.05
0.10
0.15
Phosphorus loading rate ([ ).lg P] liter l d- l )
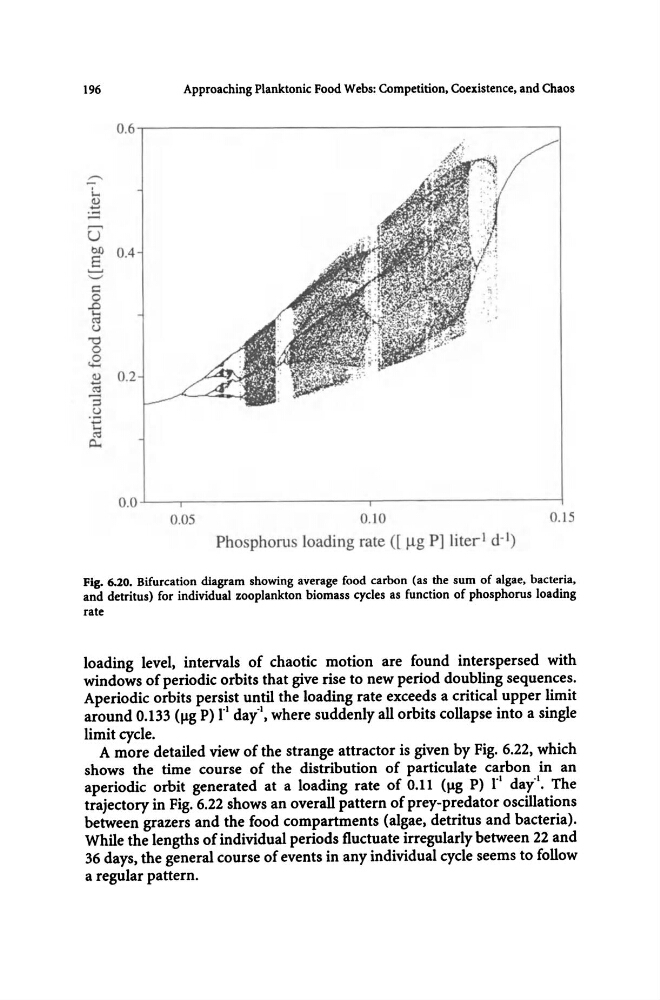
Fig. 6.20. Bifurcation diagram showing average food carbon (as the sum of algae, bacteria.
and detritus) for individual zooplankton biomass cycles as function of phosphorus loading
rate
loading level, intervals of chaotic motion are found interspersed with
windows of periodic orbits that give rise to new period doubling sequences.
Aperiodic orbits persist until the loading rate exceeds a critical upper limit
around 0.133 (~g p) r l day"" where suddenly all orbits collapse into a single
limit cycle.
A more detailed view of the strange attractor is given by Fig. 6.22, which
shows the time course of the distribution of particulate carbon in an
aperiodic orbit generated at a loading rate of 0.11 (~g P) 1"1 day"l. The
trajectory in Fig. 6.22 shows an overall pattern of prey-predator oscillations
between grazers and the food compartments (algae, detritus and bacteria).
While the lengths of individual periods fluctuate irregularly between 22 and
36 days, the general course of events in any individual cycle seems to follow
a regular pattern.
Approaching Planktonic Food Webs: Competition, Coexistence, and Chaos
0.6
".......
,
'~
....
. -
......,
U
00 0.4
.s
' - '
c
0
.D
'C"O
U
'"0
0
.2
~
0.2
....
C"O
='
U
.~
P...
O.O~--.-----------------~------------------~
0.05
0.10
0.15
Phosphorus loading rate ([ ).lg P] liter l d- l )
Fig. 6.20. Bifurcation diagram showing average food carbon (as the sum of algae, bacteria.
and detritus) for individual zooplankton biomass cycles as function of phosphorus loading
rate
loading level, intervals of chaotic motion are found interspersed with
windows of periodic orbits that give rise to new period doubling sequences.
Aperiodic orbits persist until the loading rate exceeds a critical upper limit
around 0.133 (~g p) r l day"" where suddenly all orbits collapse into a single
limit cycle.
A more detailed view of the strange attractor is given by Fig. 6.22, which
shows the time course of the distribution of particulate carbon in an
aperiodic orbit generated at a loading rate of 0.11 (~g P) 1"1 day"l. The
trajectory in Fig. 6.22 shows an overall pattern of prey-predator oscillations
between grazers and the food compartments (algae, detritus and bacteria).
While the lengths of individual periods fluctuate irregularly between 22 and
36 days, the general course of events in any individual cycle seems to follow
a regular pattern.