

Differential Loss Rates and Invadability of Equilibria
185
10
-.
~"~
-
~
I
8
"C
Cp
~
(I)
.....
Species 1
....
- 6
~
superior
Z
bQ
competitor
::t
........
-- 4
~
~.y
~
pa~bt\\a:.:.;...:.»
-
S . 2
_::r--p,.. 2
pecles .... .....--.p,..
superior
::s
rIl
competitor
Z
0
0.0
0.1
0.2
0.3
0.4
0.5
P supply rate ([)lg P] liter- 1 d- 1 )
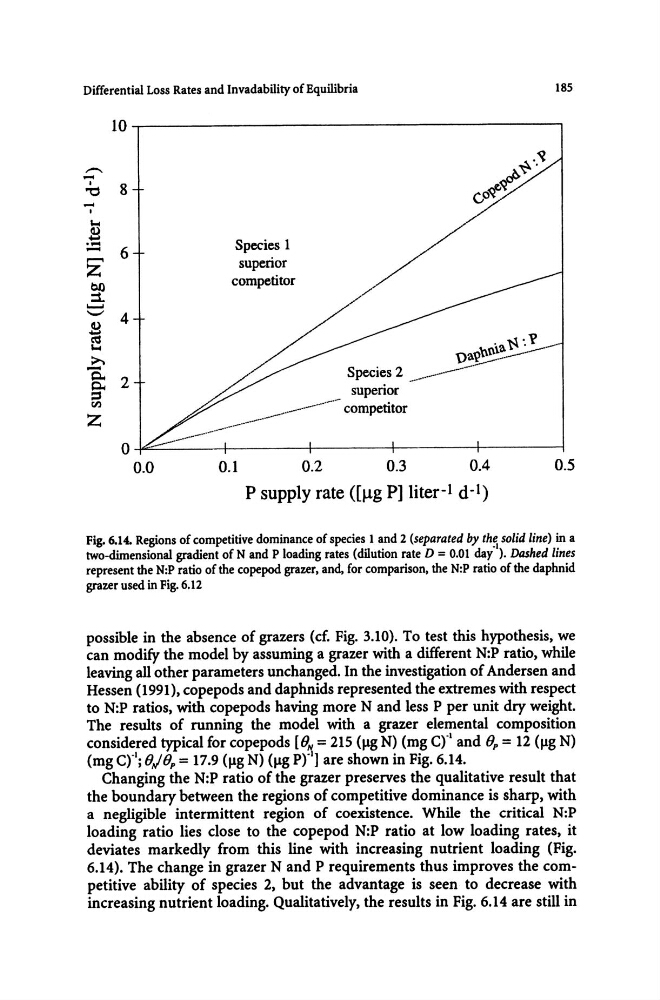
Fig. 6.14. Regions of competitive dominance of species 1 and 2 (separated by the solid line) in a
two-dimensional gradient of N and P loading rates (dilution rate D = 0.01 day·I). Dashed lines
represent the N:P ratio of the copepod grazer, and, for comparison, the N:P ratio of the daphnid
grazer used in Fig. 6.12
possible in the absence of grazers (cf. Fig. 3.10). To test this hypothesis, we
can modify the model by assuming a grazer with a different N:P ratio, while
leaving all other parameters unchanged. In the investigation of Andersen and
Hessen (1991), copepods and daphnids represented the extremes with respect
to N:P ratios, with copepods having more N and less P per unit dry weight.
The results of running the model with a grazer elemental composition
considered typical for copepods [ON = 215 (J.1g N) (mg ct and Op = 12 (J.1g N)
(mg C).I; O,/Op = 17.9 (J.1g N) (J.1g ptJ are shown in Fig. 6.14.
Changing the N:P ratio of the grazer preserves the qualitative result that
the boundary between the regions of competitive dominance is sharp, with
a negligible intermittent region of coexistence. While the critical N:P
loading ratio lies close to the copepod N:P ratio at low loading rates, it
deviates markedly from this line with increasing nutrient loading (Fig.
6.14). The change in grazer Nand P requirements thus improves the competitive ability of species 2, but the advantage is seen to decrease with
increasing nutrient loading. Qualitatively, the results in Fig. 6.14 are still in
185
10
-.
~"~
-
~
I
8
"C
Cp
~
(I)
.....
Species 1
....
- 6
~
superior
Z
bQ
competitor
::t
........
-- 4
~
~.y
~
pa~bt\\a:.:.;...:.»
-
S . 2
_::r--p,.. 2
pecles .... .....--.p,..
superior
::s
rIl
competitor
Z
0
0.0
0.1
0.2
0.3
0.4
0.5
P supply rate ([)lg P] liter- 1 d- 1 )
Fig. 6.14. Regions of competitive dominance of species 1 and 2 (separated by the solid line) in a
two-dimensional gradient of N and P loading rates (dilution rate D = 0.01 day·I). Dashed lines
represent the N:P ratio of the copepod grazer, and, for comparison, the N:P ratio of the daphnid
grazer used in Fig. 6.12
possible in the absence of grazers (cf. Fig. 3.10). To test this hypothesis, we
can modify the model by assuming a grazer with a different N:P ratio, while
leaving all other parameters unchanged. In the investigation of Andersen and
Hessen (1991), copepods and daphnids represented the extremes with respect
to N:P ratios, with copepods having more N and less P per unit dry weight.
The results of running the model with a grazer elemental composition
considered typical for copepods [ON = 215 (J.1g N) (mg ct and Op = 12 (J.1g N)
(mg C).I; O,/Op = 17.9 (J.1g N) (J.1g ptJ are shown in Fig. 6.14.
Changing the N:P ratio of the grazer preserves the qualitative result that
the boundary between the regions of competitive dominance is sharp, with
a negligible intermittent region of coexistence. While the critical N:P
loading ratio lies close to the copepod N:P ratio at low loading rates, it
deviates markedly from this line with increasing nutrient loading (Fig.
6.14). The change in grazer Nand P requirements thus improves the competitive ability of species 2, but the advantage is seen to decrease with
increasing nutrient loading. Qualitatively, the results in Fig. 6.14 are still in