

Differential Loss Rates and Invadability of Equilibria
183
.....
~
....
.- -
z
5 ~------------------------'---------~--~
3
2
Species 1
superior
competitor
Species 2
superior
competitor
0 +-------~----~~----_4------_+------~
0.0
0.1
0.2
0.3
0.4
0.5
P supply rate ([J.lg P] liter - I d- I )
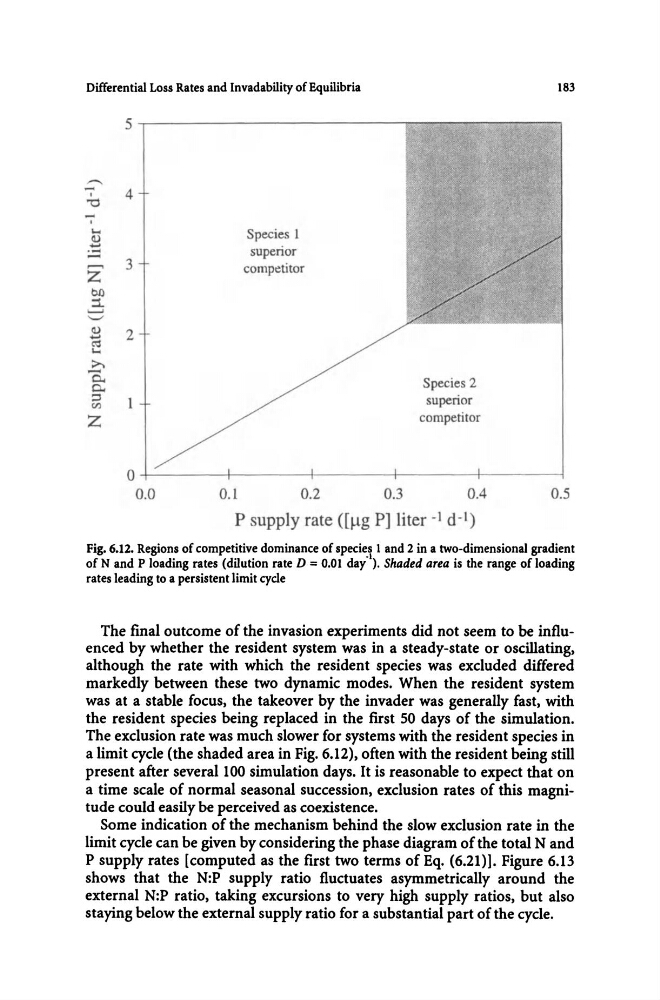
Fig. 6.12. Regions of competitive dominance of species 1 and 2 in a two-dimensional gradient
of Nand P loading rates (dilution rate D = 0.01 day' \ Shaded area is the range of loading
rates leading to a persistent limit cycle
The final outcome of the invasion experiments did not seem to be influenced by whether the resident system was in a steady-state or oscillating,
although the rate with which the resident species was excluded differed
markedly between these two dynamic modes. When the resident system
was at a stable focus, the takeover by the invader was generally fast, with
the resident species being replaced in the first 50 days of the simulation.
The exclusion rate was much slower for systems with the resident species in
a limit cycle (the shaded area in Fig. 6.12), often with the resident being still
present after several 100 simulation days. It is reasonable to expect that on
a time scale of normal seasonal succession, exclusion rates of this magnitude could easily be perceived as coexistence.
Some indication of the mechanism behind the slow exclusion rate in the
limit cycle can be given by considering the phase diagram of the total Nand
p supply rates [computed as the first two terms of Eq. (6.21)]. Figure 6.13
shows that the N:P supply ratio fluctuates asymmetrically around the
external N:P ratio, taking excursions to very high supply ratios, but also
staying below the external supply ratio for a substantial part of the cycle.
183
.....
~
....
.- -
z
5 ~------------------------'---------~--~
3
2
Species 1
superior
competitor
Species 2
superior
competitor
0 +-------~----~~----_4------_+------~
0.0
0.1
0.2
0.3
0.4
0.5
P supply rate ([J.lg P] liter - I d- I )
Fig. 6.12. Regions of competitive dominance of species 1 and 2 in a two-dimensional gradient
of Nand P loading rates (dilution rate D = 0.01 day' \ Shaded area is the range of loading
rates leading to a persistent limit cycle
The final outcome of the invasion experiments did not seem to be influenced by whether the resident system was in a steady-state or oscillating,
although the rate with which the resident species was excluded differed
markedly between these two dynamic modes. When the resident system
was at a stable focus, the takeover by the invader was generally fast, with
the resident species being replaced in the first 50 days of the simulation.
The exclusion rate was much slower for systems with the resident species in
a limit cycle (the shaded area in Fig. 6.12), often with the resident being still
present after several 100 simulation days. It is reasonable to expect that on
a time scale of normal seasonal succession, exclusion rates of this magnitude could easily be perceived as coexistence.
Some indication of the mechanism behind the slow exclusion rate in the
limit cycle can be given by considering the phase diagram of the total Nand
p supply rates [computed as the first two terms of Eq. (6.21)]. Figure 6.13
shows that the N:P supply ratio fluctuates asymmetrically around the
external N:P ratio, taking excursions to very high supply ratios, but also
staying below the external supply ratio for a substantial part of the cycle.