

180
Approaching Planktonic Food Webs: Competition, Coexistence, and Chaos
The right-hand side ofEq. (6.18) will be >1 whenever QJQp > OJO,. and <1
when QJQp < OJO". That is, when the N:P ratio of the food is higher than the
requirements of the grazer, the N:P ratio of recycled nutrients will be even
higher, and vice versa. If the recycled nutrients are completely assimilated by
the food organisms, then the food N:P ratio will either increase or decrease,
except for the special case when food composition exactly matches the
requirements of the grazer. It should be noticed that this divergence of N:P
ratios as a result of grazing is not dependent on the particular function
chosen in Eq. (6.15); it would be the same for a general growth model g =
G(Q,J 0,. QJ ON)' with G being an arbitrary bivariate function.
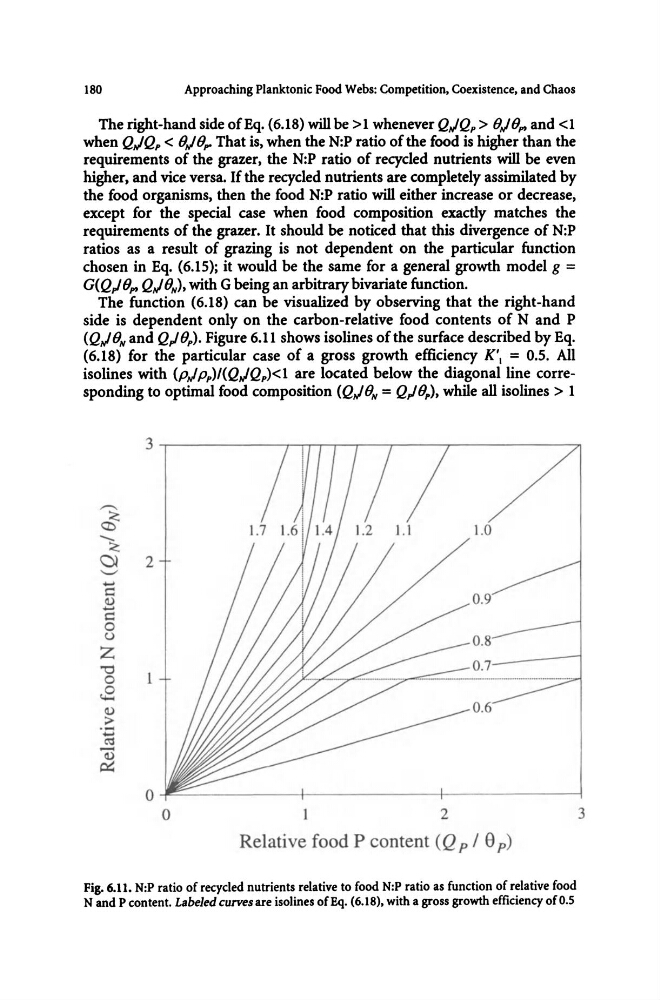
The function (6.18) can be visualized by observing that the right-hand
side is dependent only on the carbon-relative food contents of Nand P
(QJON and Q,JOp). Figure 6.11 shows isolines of the surface described by Eq.
(6.18) for the particular case of a gross growth efficiency K'\ = 0.5. All
isolines with (p,/pp)/(Q,/Qp)<1 are located below the diagonal line corresponding to optimal food composition (Q,/ ON = Q,J Op), while all isolines > 1
3 .-----------"TT,-,,--,----,----------~
.........
<5
- ~
Ql
2
'-"
.....
s:::
Il,)
.....
s:::
0
u
Z
'" 1
0
..8
Il,)
>
.- .....
~
.-.
(\)
cz:::
o~~-----------+--------------+-------------~
o
I
2
Relative food P content (Q p / e p)
Fig. 6.11. N:P ratio of recycled nutrients relative to food N:P ratio as function of relative food
Nand P content. Labeled curves are isolines ofEq. (6.18), with a gross growth efficiency of 0.5
3
Approaching Planktonic Food Webs: Competition, Coexistence, and Chaos
The right-hand side ofEq. (6.18) will be >1 whenever QJQp > OJO,. and <1
when QJQp < OJO". That is, when the N:P ratio of the food is higher than the
requirements of the grazer, the N:P ratio of recycled nutrients will be even
higher, and vice versa. If the recycled nutrients are completely assimilated by
the food organisms, then the food N:P ratio will either increase or decrease,
except for the special case when food composition exactly matches the
requirements of the grazer. It should be noticed that this divergence of N:P
ratios as a result of grazing is not dependent on the particular function
chosen in Eq. (6.15); it would be the same for a general growth model g =
G(Q,J 0,. QJ ON)' with G being an arbitrary bivariate function.
The function (6.18) can be visualized by observing that the right-hand
side is dependent only on the carbon-relative food contents of Nand P
(QJON and Q,JOp). Figure 6.11 shows isolines of the surface described by Eq.
(6.18) for the particular case of a gross growth efficiency K'\ = 0.5. All
isolines with (p,/pp)/(Q,/Qp)<1 are located below the diagonal line corresponding to optimal food composition (Q,/ ON = Q,J Op), while all isolines > 1
3 .-----------"TT,-,,--,----,----------~
.........
<5
- ~
Ql
2
'-"
.....
s:::
Il,)
.....
s:::
0
u
Z
'" 1
0
..8
Il,)
>
.- .....
~
.-.
(\)
cz:::
o~~-----------+--------------+-------------~
o
I
2
Relative food P content (Q p / e p)
Fig. 6.11. N:P ratio of recycled nutrients relative to food N:P ratio as function of relative food
Nand P content. Labeled curves are isolines ofEq. (6.18), with a gross growth efficiency of 0.5
3