

Eutrophication as an r-KSelection Gradient
165
0.5 . , - - - - - - - - - - - - - - - - - - - - - - - ,
---.
- , .... 0.4
B
.- -
G
a 0.3
"-'
'-'
til
til
t':S
e
0
0.2
..0
r:I
j
1+3
-
0.1
0..
0
0
N
O.O+-----------r---------~----------_r----------~
o
1
2
3
4
Phytoplankton biomass ([mg C] liter-I)
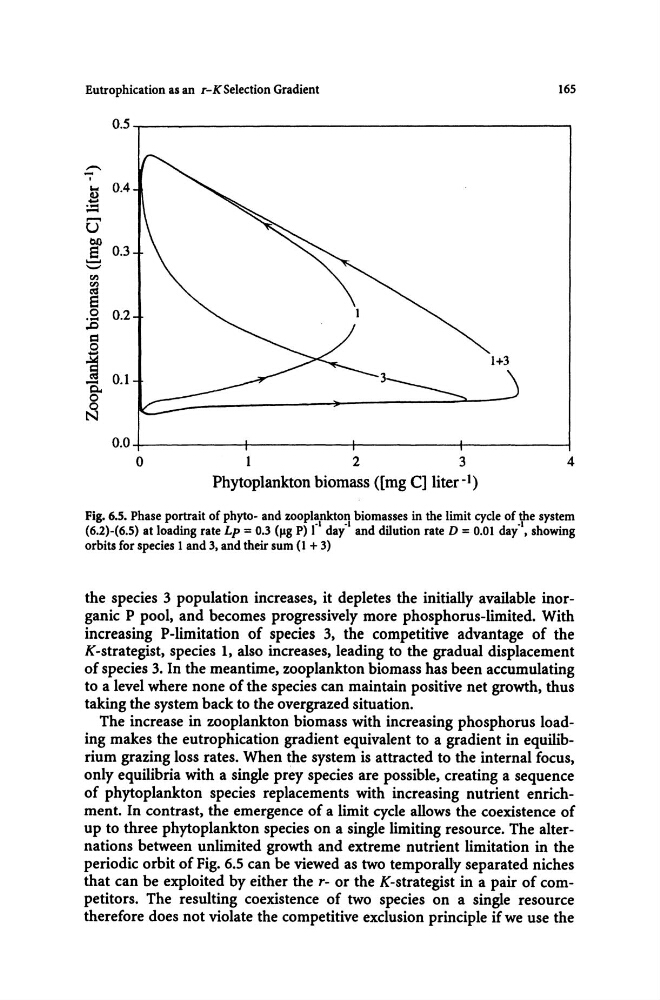
Fig. 6.5. Phase portrait of phyto- and zooplankton biomasses in the limit cycle of the system
(6.2)-(6.5) at loading rate Lp = 0.3 (IIg P) r' day·' and dilution rate D = 0.01 day·', showing
orbits for species 1 and 3, and their sum (1 + 3)
the species 3 population increases, it depletes the initially available inorganic P pool, and becomes progressively more phosphorus-limited. With
increasing P-limitation of species 3, the competitive advantage of the
K-strategist, species 1, also increases, leading to the gradual displacement
of species 3. In the meantime, zooplankton biomass has been accumulating
to a level where none of the species can maintain positive net growth, thus
taking the system back to the overgrazed situation.
The increase in zooplankton biomass with increasing phosphorus loading makes the eutrophication gradient equivalent to a gradient in equilibrium grazing loss rates. When the system is attracted to the internal focus,
only equilibria with a single prey species are possible, creating a sequence
of phytoplankton species replacements with increasing nutrient enrichment. In contrast, the emergence of a limit cycle allows the coexistence of
up to three phytoplankton species on a single limiting resource. The alternations between unlimited growth and extreme nutrient limitation in the
periodic orbit of Fig. 6.5 can be viewed as two temporally separated niches
that can be exploited by either the r- or the K-strategist in a pair of competitors. The resulting coexistence of two species on a single resource
therefore does not violate the competitive exclusion principle if we use the
165
0.5 . , - - - - - - - - - - - - - - - - - - - - - - - ,
---.
- , .... 0.4
B
.- -
G
a 0.3
"-'
'-'
til
til
t':S
e
0
0.2
..0
r:I
j
1+3
-
0.1
0..
0
0
N
O.O+-----------r---------~----------_r----------~
o
1
2
3
4
Phytoplankton biomass ([mg C] liter-I)
Fig. 6.5. Phase portrait of phyto- and zooplankton biomasses in the limit cycle of the system
(6.2)-(6.5) at loading rate Lp = 0.3 (IIg P) r' day·' and dilution rate D = 0.01 day·', showing
orbits for species 1 and 3, and their sum (1 + 3)
the species 3 population increases, it depletes the initially available inorganic P pool, and becomes progressively more phosphorus-limited. With
increasing P-limitation of species 3, the competitive advantage of the
K-strategist, species 1, also increases, leading to the gradual displacement
of species 3. In the meantime, zooplankton biomass has been accumulating
to a level where none of the species can maintain positive net growth, thus
taking the system back to the overgrazed situation.
The increase in zooplankton biomass with increasing phosphorus loading makes the eutrophication gradient equivalent to a gradient in equilibrium grazing loss rates. When the system is attracted to the internal focus,
only equilibria with a single prey species are possible, creating a sequence
of phytoplankton species replacements with increasing nutrient enrichment. In contrast, the emergence of a limit cycle allows the coexistence of
up to three phytoplankton species on a single limiting resource. The alternations between unlimited growth and extreme nutrient limitation in the
periodic orbit of Fig. 6.5 can be viewed as two temporally separated niches
that can be exploited by either the r- or the K-strategist in a pair of competitors. The resulting coexistence of two species on a single resource
therefore does not violate the competitive exclusion principle if we use the