

Eutrophication as an r-KSelection Gradient
" S
p,= P, K' +S'
159
(6.1)
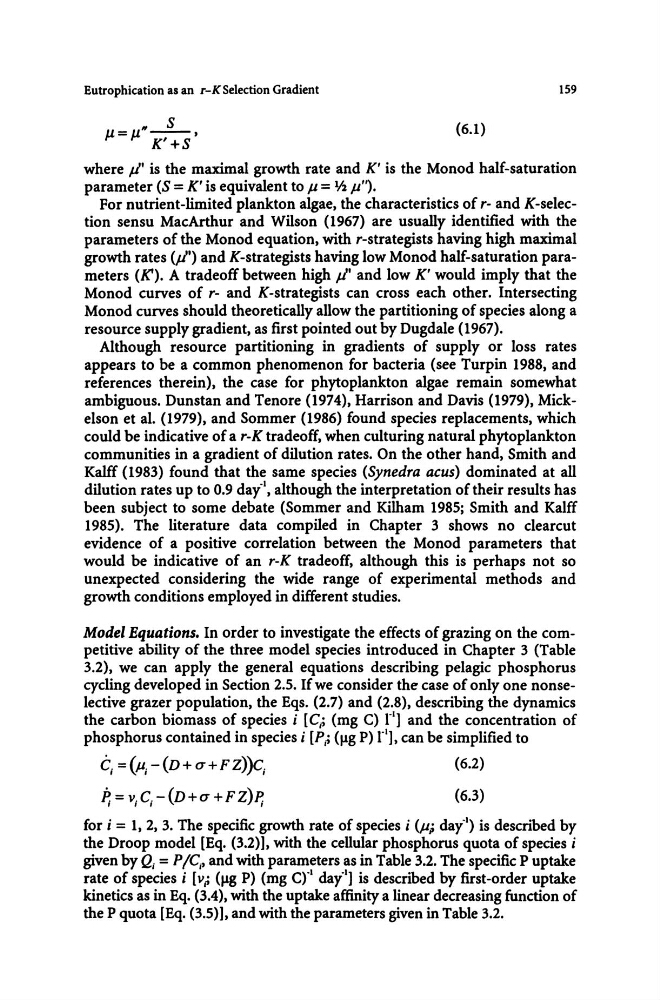
where Ji' is the maximal growth rate and K' is the Monod half-saturation
parameter (S = K'is equivalent to J.l = 1h J.l'~.
For nutrient-limited plankton algae, the characteristics of r- and K-selection sensu MacArthur and Wilson (1967) are usually identified with the
parameters of the Monod equation, with r-strategists having high maximal
growth rates (Ji') and K-strategists having low Monod half-saturation parameters (K'). A tradeoff between high Ji' and low K' would imply that the
Monod curves of r- and K-strategists can cross each other. Intersecting
Monod curves should theoretically allow the partitioning of species along a
resource supply gradient, as first pointed out by Dugdale (1967).
Although resource partitioning in gradients of supply or loss rates
appears to be a common phenomenon for bacteria (see Turpin 1988, and
references therein), the case for phytoplankton algae remain somewhat
ambiguous. Dunstan and Tenore (1974), Harrison and Davis (1979), Mickelson et al. (1979), and Sommer (1986) found species replacements, which
could be indicative of a r-K tradeoff, when culturing natural phytoplankton
communities in a gradient of dilution rates. On the other hand, Smith and
Kalff (1983) found that the same species (Synedra acus) dominated at all
dilution rates up to 0.9 day"l, although the interpretation of their results has
been subject to some debate (Sommer and Kilham 1985; Smith and Kalff
1985). The literature data compiled in Chapter 3 shows no dearcut
evidence of a positive correlation between the Monod parameters that
would be indicative of an r-K tradeoff, although this is perhaps not so
unexpected considering the wide range of experimental methods and
growth conditions employed in different studies.
Model Equations. In order to investigate the effects of grazing on the competitive ability of the three model species introduced in Chapter 3 (Table
3.2), we can apply the general equations describing pelagic phosphorus
cycling developed in Section 2.5. If we consider the case of only one nonselective grazer population, the Eqs. (2.7) and (2.8), describing the dynamics
the carbon biomass of species i [C/; (mg C) rl] and the concentration of
phosphorus contained in species i [Pp (fJg P) rl], can be simplified to
(;, =(p;-(V+u+FZ»c;
(6.2)
P;=v,C,-(V+u+FZ)J;
(6.3)
for i = 1,2,3. The specific growth rate of species i (JJ; day"l) is descnbed by
the Droop model [Eq. (3.2)], with the cellular phosphorus quota of species i
given by Q, = P ICI' and with parameters as in Table 3.2. The specific P uptake
rate of species i [vp (fJ8 P) (mg cr l day"l] is described by first-order uptake
kinetics as in Eq. (3.4), with the uptake affinity a linear decreasing function of
the P quota [Eq. (3.5)], and with the parameters given in Table 3.2.
" S
p,= P, K' +S'
159
(6.1)
where Ji' is the maximal growth rate and K' is the Monod half-saturation
parameter (S = K'is equivalent to J.l = 1h J.l'~.
For nutrient-limited plankton algae, the characteristics of r- and K-selection sensu MacArthur and Wilson (1967) are usually identified with the
parameters of the Monod equation, with r-strategists having high maximal
growth rates (Ji') and K-strategists having low Monod half-saturation parameters (K'). A tradeoff between high Ji' and low K' would imply that the
Monod curves of r- and K-strategists can cross each other. Intersecting
Monod curves should theoretically allow the partitioning of species along a
resource supply gradient, as first pointed out by Dugdale (1967).
Although resource partitioning in gradients of supply or loss rates
appears to be a common phenomenon for bacteria (see Turpin 1988, and
references therein), the case for phytoplankton algae remain somewhat
ambiguous. Dunstan and Tenore (1974), Harrison and Davis (1979), Mickelson et al. (1979), and Sommer (1986) found species replacements, which
could be indicative of a r-K tradeoff, when culturing natural phytoplankton
communities in a gradient of dilution rates. On the other hand, Smith and
Kalff (1983) found that the same species (Synedra acus) dominated at all
dilution rates up to 0.9 day"l, although the interpretation of their results has
been subject to some debate (Sommer and Kilham 1985; Smith and Kalff
1985). The literature data compiled in Chapter 3 shows no dearcut
evidence of a positive correlation between the Monod parameters that
would be indicative of an r-K tradeoff, although this is perhaps not so
unexpected considering the wide range of experimental methods and
growth conditions employed in different studies.
Model Equations. In order to investigate the effects of grazing on the competitive ability of the three model species introduced in Chapter 3 (Table
3.2), we can apply the general equations describing pelagic phosphorus
cycling developed in Section 2.5. If we consider the case of only one nonselective grazer population, the Eqs. (2.7) and (2.8), describing the dynamics
the carbon biomass of species i [C/; (mg C) rl] and the concentration of
phosphorus contained in species i [Pp (fJg P) rl], can be simplified to
(;, =(p;-(V+u+FZ»c;
(6.2)
P;=v,C,-(V+u+FZ)J;
(6.3)
for i = 1,2,3. The specific growth rate of species i (JJ; day"l) is descnbed by
the Droop model [Eq. (3.2)], with the cellular phosphorus quota of species i
given by Q, = P ICI' and with parameters as in Table 3.2. The specific P uptake
rate of species i [vp (fJ8 P) (mg cr l day"l] is described by first-order uptake
kinetics as in Eq. (3.4), with the uptake affinity a linear decreasing function of
the P quota [Eq. (3.5)], and with the parameters given in Table 3.2.