

Phosphorus-Biomass Relationships in Lakes
153
tOO
0
0
0
...-. ....
0 0 0
,
' ""'
~
....
.....
- on
:1.
10
'--'
~
0
-
->- -.
...d
0
0..
0
' ""'
0
1
-
0
...d
U
1
10
100
Particulate phosphorus ([J.!g P] liter-I)
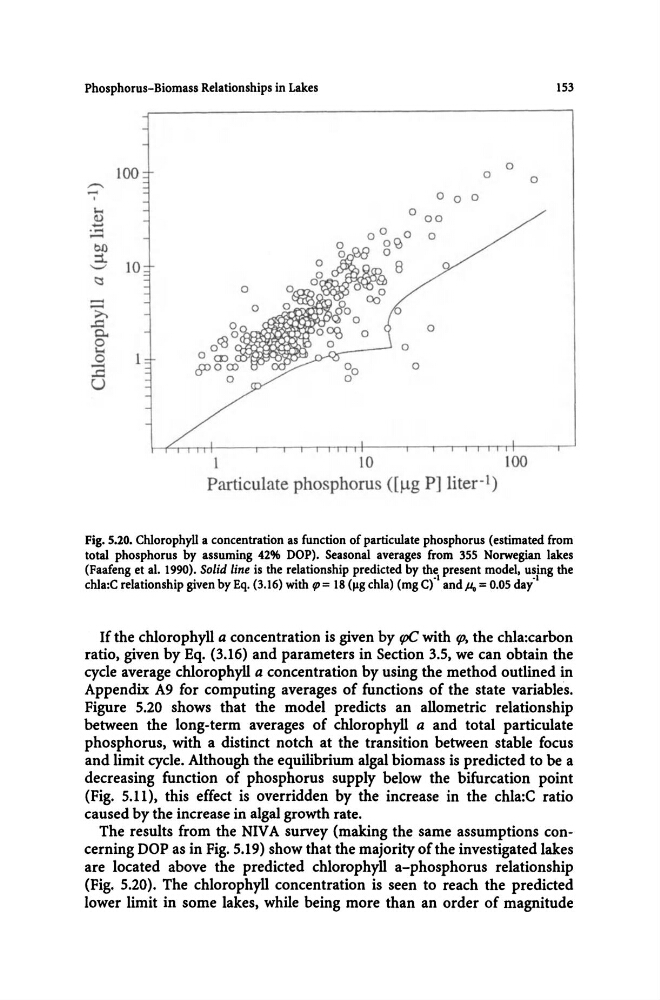
Fig. S.20. Chlorophyll a concentration as function of particulate phosphorus (estimated from
total phosphorus by assuming 42% DOP). Seasonal averages from 355 Norwegian lakes
(Faafeng et a1. 1990). Solid line is the relationship predicted by the present model. using the
chla:C relationship given by Eq. (3.16) with fP= 18 ("g chla) (mg C)"I and,u. = 0.05 day·1
If the chlorophyll a concentration is given by rpC with fIJ. the chla:carbon
ratio. given by Eq. (3.16) and parameters in Section 3.5. we can obtain the
cycle average chlorophyll a concentration by using the method outlined in
Appendix A9 for computing averages of functions of the state variables.
Figure 5.20 shows that the model predicts an allometric relationship
between the long-term averages of chlorophyll a and total particulate
phosphorus. with a distinct notch at the transition between stable focus
and limit cycle. Although the equilibrium algal biomass is predicted to be a
decreasing function of phosphorus supply below the bifurcation point
(Fig. 5.11). this effect is overridden by the increase in the chla:C ratio
caused by the increase in algal growth rate.
The results from the NIV A survey (making the same assumptions concerning DOP as in Fig. 5.19) show that the majority ofthe investigated lakes
are located above the predicted chlorophyll a-phosphorus relationship
(Fig. 5.20). The chlorophyll concentration is seen to reach the predicted
lower limit in some lakes. while being more than an order of magnitude
153
tOO
0
0
0
...-. ....
0 0 0
,
' ""'
~
....
.....
- on
:1.
10
'--'
~
0
-
->- -.
...d
0
0..
0
' ""'
0
1
-
0
...d
U
1
10
100
Particulate phosphorus ([J.!g P] liter-I)
Fig. S.20. Chlorophyll a concentration as function of particulate phosphorus (estimated from
total phosphorus by assuming 42% DOP). Seasonal averages from 355 Norwegian lakes
(Faafeng et a1. 1990). Solid line is the relationship predicted by the present model. using the
chla:C relationship given by Eq. (3.16) with fP= 18 ("g chla) (mg C)"I and,u. = 0.05 day·1
If the chlorophyll a concentration is given by rpC with fIJ. the chla:carbon
ratio. given by Eq. (3.16) and parameters in Section 3.5. we can obtain the
cycle average chlorophyll a concentration by using the method outlined in
Appendix A9 for computing averages of functions of the state variables.
Figure 5.20 shows that the model predicts an allometric relationship
between the long-term averages of chlorophyll a and total particulate
phosphorus. with a distinct notch at the transition between stable focus
and limit cycle. Although the equilibrium algal biomass is predicted to be a
decreasing function of phosphorus supply below the bifurcation point
(Fig. 5.11). this effect is overridden by the increase in the chla:C ratio
caused by the increase in algal growth rate.
The results from the NIV A survey (making the same assumptions concerning DOP as in Fig. 5.19) show that the majority ofthe investigated lakes
are located above the predicted chlorophyll a-phosphorus relationship
(Fig. 5.20). The chlorophyll concentration is seen to reach the predicted
lower limit in some lakes. while being more than an order of magnitude