

138
Nutrients. Algae and Herbivores - the Paradox of Enrichment Revisited
Phyloplankton
2.0
~
... 1.0
~
U
1>0
.§. 0.0
~
0
:0
0.4
c
0
~ 0 .2
U
0 .0
0
50
100
150
200
Tim~ (d)
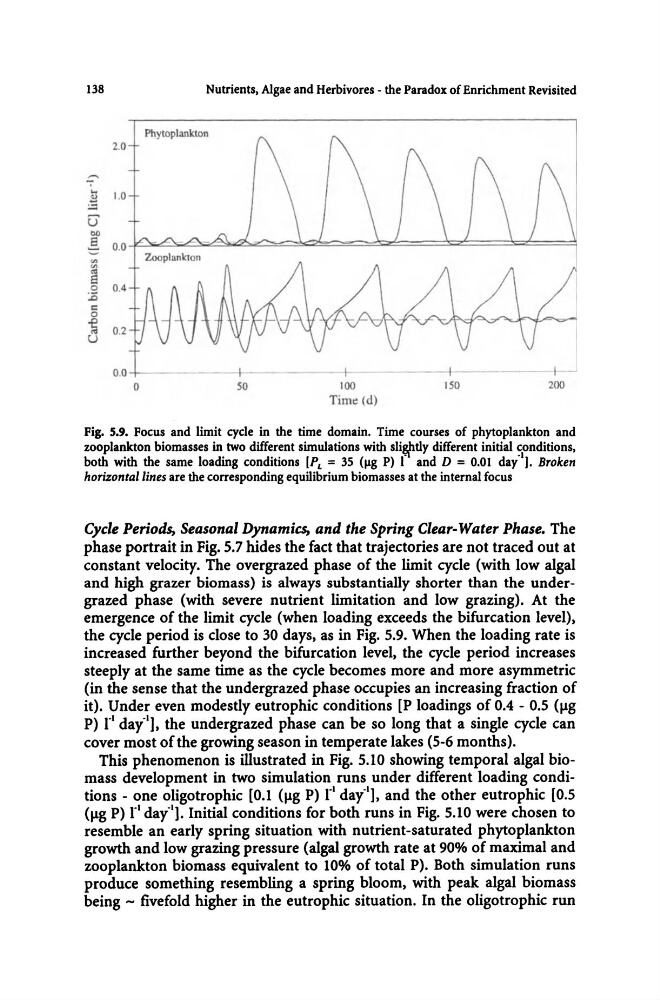
Fig. 5.9. Focus and limit cycle in the time domain. Time courses of phytoplankton and
zooplankton biomasses in two different simulations with sli~tly different initial conditions.
both with the same loading conditions [P L = 35 (Jig P) rand D = 0.01 day·I]. Broken
horizontal lines are the corresponding equilibrium biomasses at the internal focus
Cycle Periods, Seasonal Dynamics, and the Spring Clear-Water Phase. The
phase portrait in Fig. 5.7 hides the fact that trajectories are not traced out at
constant velocity. The overgrazed phase of the limit cycle (with low algal
and high grazer biomass) is always substantially shorter than the undergrazed phase (with severe nutrient limitation and low grazing). At the
emergence of the limit cycle (when loading exceeds the bifurcation level),
the cycle period is close to 30 days, as in Fig. 5.9. When the loading rate is
increased further beyond the bifurcation level, the cycle period increases
steeply at the same time as the cycle becomes more and more asymmetric
(in the sense that the undergrazed phase occupies an increasing fraction of
it). Under even modestly eutrophic conditions [P loadings of 0.4 - 0.5 (Ilg
P) 1" day'I], the undergrazed phase can be so long that a single cycle can
cover most ofthe growing season in temperate lakes (5-6 months).
This phenomenon is illustrated in Fig. 5.10 showing temporal algal biomass development in two simulation runs under different loading conditions - one oligotrophic [0.1 (Ilg P) 1' 1 day"], and the other eutrophic [0.5
(Ilg P) 1" day"]. Initial conditions for both runs in Fig. 5.10 were chosen to
resemble an early spring situation with nutrient-saturated phytoplankton
growth and low grazing pressure (algal growth rate at 90% of maximal and
zooplankton biomass equivalent to 10% of total P). Both simulation runs
produce something resembling a spring bloom, with peak algal biomass
being - fivefold higher in the eutrophic situation. In the oligotrophic run
Nutrients. Algae and Herbivores - the Paradox of Enrichment Revisited
Phyloplankton
2.0
~
... 1.0
~
U
1>0
.§. 0.0
~
0
:0
0.4
c
0
~ 0 .2
U
0 .0
0
50
100
150
200
Tim~ (d)
Fig. 5.9. Focus and limit cycle in the time domain. Time courses of phytoplankton and
zooplankton biomasses in two different simulations with sli~tly different initial conditions.
both with the same loading conditions [P L = 35 (Jig P) rand D = 0.01 day·I]. Broken
horizontal lines are the corresponding equilibrium biomasses at the internal focus
Cycle Periods, Seasonal Dynamics, and the Spring Clear-Water Phase. The
phase portrait in Fig. 5.7 hides the fact that trajectories are not traced out at
constant velocity. The overgrazed phase of the limit cycle (with low algal
and high grazer biomass) is always substantially shorter than the undergrazed phase (with severe nutrient limitation and low grazing). At the
emergence of the limit cycle (when loading exceeds the bifurcation level),
the cycle period is close to 30 days, as in Fig. 5.9. When the loading rate is
increased further beyond the bifurcation level, the cycle period increases
steeply at the same time as the cycle becomes more and more asymmetric
(in the sense that the undergrazed phase occupies an increasing fraction of
it). Under even modestly eutrophic conditions [P loadings of 0.4 - 0.5 (Ilg
P) 1" day'I], the undergrazed phase can be so long that a single cycle can
cover most ofthe growing season in temperate lakes (5-6 months).
This phenomenon is illustrated in Fig. 5.10 showing temporal algal biomass development in two simulation runs under different loading conditions - one oligotrophic [0.1 (Ilg P) 1' 1 day"], and the other eutrophic [0.5
(Ilg P) 1" day"]. Initial conditions for both runs in Fig. 5.10 were chosen to
resemble an early spring situation with nutrient-saturated phytoplankton
growth and low grazing pressure (algal growth rate at 90% of maximal and
zooplankton biomass equivalent to 10% of total P). Both simulation runs
produce something resembling a spring bloom, with peak algal biomass
being - fivefold higher in the eutrophic situation. In the oligotrophic run