

110
Herbivores and Algae: Food Utilization, Growth and Reproduction ...
1.0~----------------~----------------~--~0.8
:>.
(,)
c::
~
i
0.6
~
:>
....
~ 0.4
- S ..
::s
U 0.2
o Rotifers
o Cladocerans
o Copepods
O.O~Lr----.---'--'r-r-ro~';-------r---.--'-"".-ro;
0.01
0.1
1
Threshold food level (mg C liter-I)
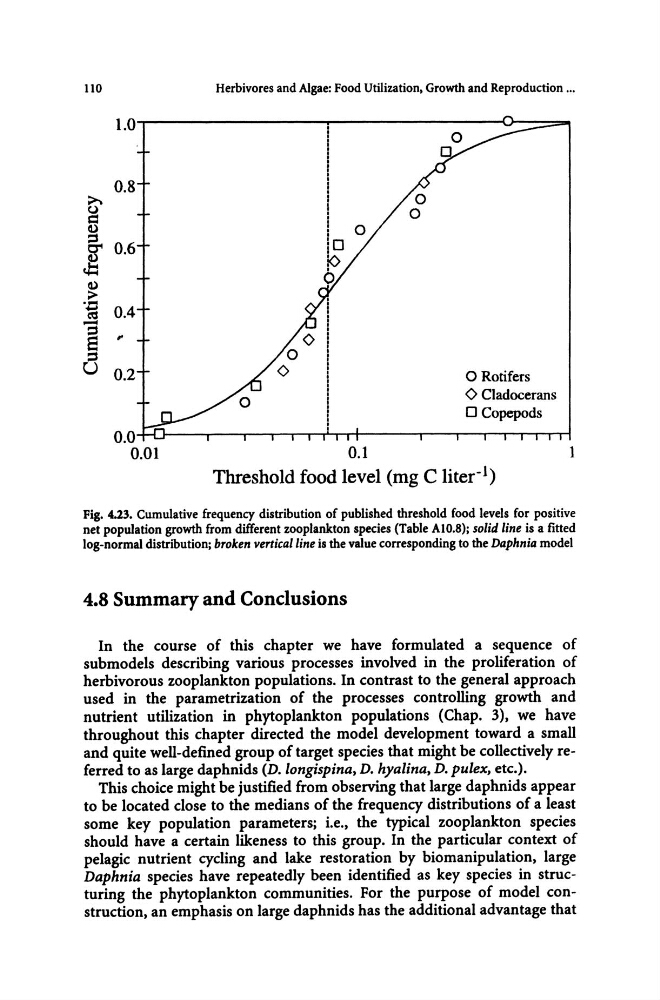
Fig. 4.23. Cumulative frequency distribution of published threshold food levels for positive
net population growth from different zooplankton species (Table AIO.8); solid line is a fitted
log-normal distribution; broken vertical line is the value corresponding to the Daphnia model
4.8 Summary and Conclusions
In the course of this chapter we have formulated a sequence of
submodels describing various processes involved in the proliferation of
herbivorous zooplankton populations. In contrast to the general approach
used in the parametrization of the processes controlling growth and
nutrient utilization in phytoplankton populations (Chap. 3), we have
throughout this chapter directed the model development toward a small
and quite well-defined group of target species that might be collectively referred to as large daphnids (D. longispina, D. hyalina, D. pulex, etc.).
This choice might be justified from observing that large daphnids appear
to be located close to the medians of the frequency distributions of a least
some key population parameters; i.e., the typical zooplankton species
should have a certain likeness to this group. In the particular context of
pelagic nutrient cycling and lake restoration by biomanipulation, large
Daphnia species have repeatedly been identified as key species in structuring the phytoplankton communities. For the purpose of model construction, an emphasis on large daphnids has the additional advantage that
Herbivores and Algae: Food Utilization, Growth and Reproduction ...
1.0~----------------~----------------~--~0.8
:>.
(,)
c::
~
i
0.6
~
:>
....
~ 0.4
- S ..
::s
U 0.2
o Rotifers
o Cladocerans
o Copepods
O.O~Lr----.---'--'r-r-ro~';-------r---.--'-"".-ro;
0.01
0.1
1
Threshold food level (mg C liter-I)
Fig. 4.23. Cumulative frequency distribution of published threshold food levels for positive
net population growth from different zooplankton species (Table AIO.8); solid line is a fitted
log-normal distribution; broken vertical line is the value corresponding to the Daphnia model
4.8 Summary and Conclusions
In the course of this chapter we have formulated a sequence of
submodels describing various processes involved in the proliferation of
herbivorous zooplankton populations. In contrast to the general approach
used in the parametrization of the processes controlling growth and
nutrient utilization in phytoplankton populations (Chap. 3), we have
throughout this chapter directed the model development toward a small
and quite well-defined group of target species that might be collectively referred to as large daphnids (D. longispina, D. hyalina, D. pulex, etc.).
This choice might be justified from observing that large daphnids appear
to be located close to the medians of the frequency distributions of a least
some key population parameters; i.e., the typical zooplankton species
should have a certain likeness to this group. In the particular context of
pelagic nutrient cycling and lake restoration by biomanipulation, large
Daphnia species have repeatedly been identified as key species in structuring the phytoplankton communities. For the purpose of model construction, an emphasis on large daphnids has the additional advantage that