

Population Survival and Proliferation: Demography
>.
u
= 11}
0.8
::s
0'" 0.6
d)
.t:
11}
>
.- ~ 0.4
]
::s
U 0.2
o Rotif¢fS
o Cladoc¢rans
o Copepods
0.1
0.2
0.5
Intrinsic rate of increase (d -1)
109
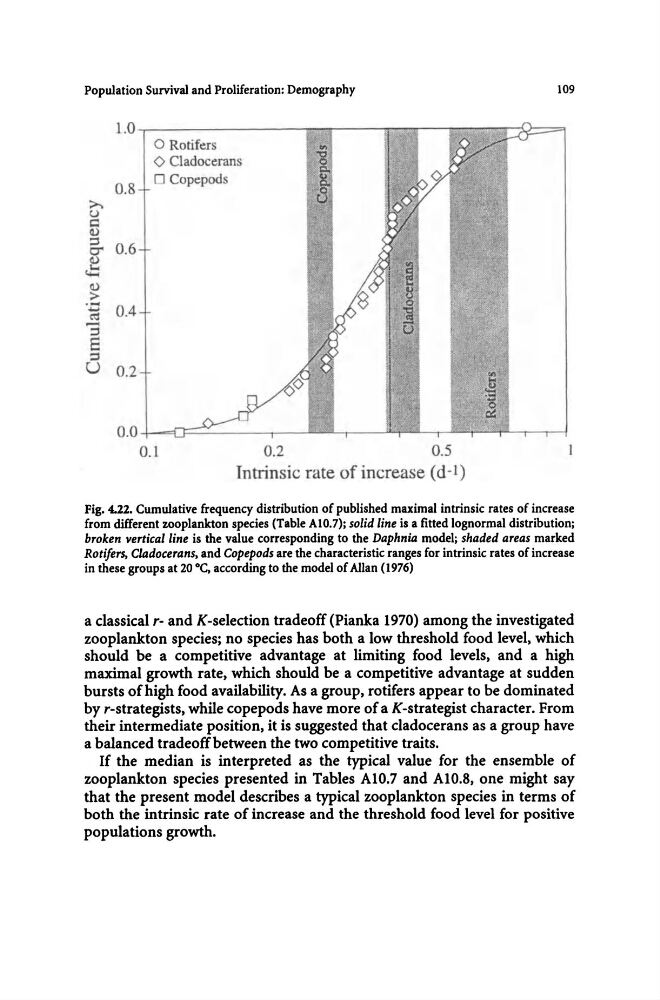
Fig. 4.22. Cumulative frequency distribution of published maximal intrinsic rates of increase
from different zooplankton species (Table AI0.7); solid line is a fitted lognormal distribution;
broken vertical line is the value corresponding to the Daphnia model; shaded areas marked
Rotifers. Cladocerans. and Copepods are the characteristic ranges for intrinsic rates of increase
in these groups at 20°C, according to the model of Allan (1976)
a classical r- and K-selection tradeoff (Pianka 1970) among the investigated
zooplankton species; no species has both a low threshold food level, which
should be a competitive advantage at limiting food levels, and a high
maximal growth rate, which should be a competitive advantage at sudden
bursts of high food availability. As a group, rotifers appear to be dominated
by r-strategists, while copepods have more of a K-strategist character. From
their intermediate position, it is suggested that cladocerans as a group have
a balanced tradeoff between the two competitive traits.
If the median is interpreted as the typical value for the ensemble of
zooplankton species presented in Tables AIO.7 and AIO.8, one might say
that the present model describes a typical zooplankton species in terms of
both the intrinsic rate of increase and the threshold food level for positive
populations growth.
>.
u
= 11}
0.8
::s
0'" 0.6
d)
.t:
11}
>
.- ~ 0.4
]
::s
U 0.2
o Rotif¢fS
o Cladoc¢rans
o Copepods
0.1
0.2
0.5
Intrinsic rate of increase (d -1)
109
Fig. 4.22. Cumulative frequency distribution of published maximal intrinsic rates of increase
from different zooplankton species (Table AI0.7); solid line is a fitted lognormal distribution;
broken vertical line is the value corresponding to the Daphnia model; shaded areas marked
Rotifers. Cladocerans. and Copepods are the characteristic ranges for intrinsic rates of increase
in these groups at 20°C, according to the model of Allan (1976)
a classical r- and K-selection tradeoff (Pianka 1970) among the investigated
zooplankton species; no species has both a low threshold food level, which
should be a competitive advantage at limiting food levels, and a high
maximal growth rate, which should be a competitive advantage at sudden
bursts of high food availability. As a group, rotifers appear to be dominated
by r-strategists, while copepods have more of a K-strategist character. From
their intermediate position, it is suggested that cladocerans as a group have
a balanced tradeoff between the two competitive traits.
If the median is interpreted as the typical value for the ensemble of
zooplankton species presented in Tables AIO.7 and AIO.8, one might say
that the present model describes a typical zooplankton species in terms of
both the intrinsic rate of increase and the threshold food level for positive
populations growth.