

Population Survival and Proliferation: Demography
103
0.4 r---------------:::=====l
-.
-
I
"0
-..-.< 0.2
0+-----0.4 +-----+---'------+-----+-------/
o
0.1
0.2
Food concentration ([mg C] liter-I)
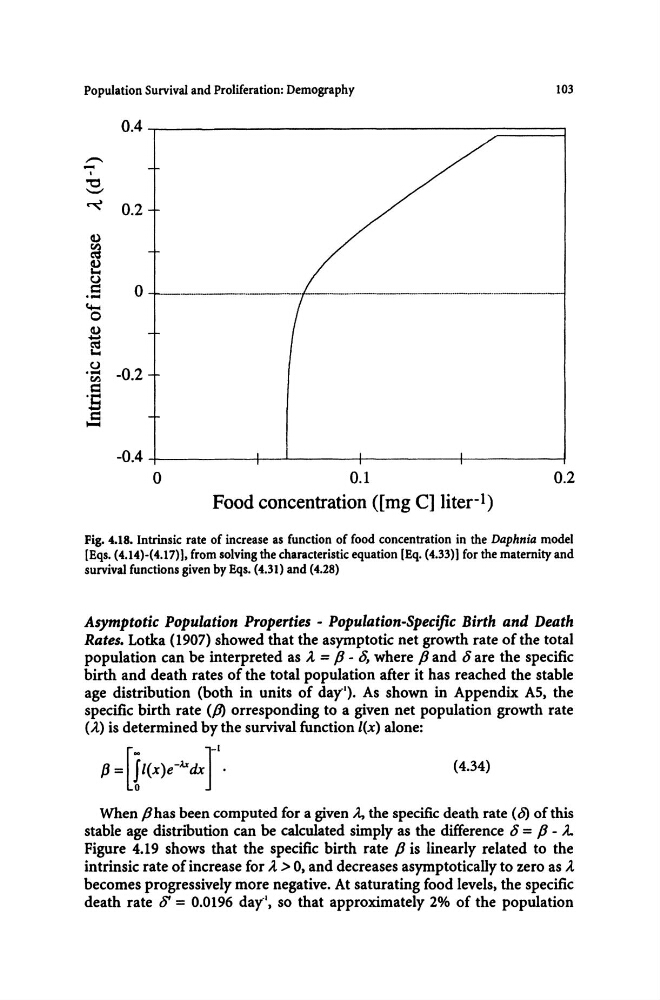
Fig. 4.18. Intrinsic rate of increase as function of food concentration in the Daphnia model
[Eqs. (4.14)-(4.17)], from solving the characteristic equation (Eq. (4.33) I for the maternity and
survival functions given by Eqs. (4.31) and (4.28)
Asymptotic Population Properties - Population-Specific Birth and Death
Rates. Lotka (1907) showed that the asymptotic net growth rate of the total
population can be interpreted as A. = P - 8, where p and 6 are the specific
birth and death rates of the total population after it has reached the stable
age distribution (both in units of day-'). As shown in Appendix AS, the
specific birth rate (fJ) orresponding to a given net population growth rate
(...:I.) is determined by the survival function l(x) alone:
(4.34)
When phas been computed for a given A., the specific death rate (b) of this
stable age distnbution can be calculated simply as the difference 6 = P - A..
Figure 4.19 shows that the specific birth rate P is linearly related to the
intrinsic rate of increase for A. > 0, and decreases asymptotically to zero as A.
becomes progressively more negative. At saturating food levels, the specific
death rate 6' = 0.0196 day-', so that approximately 2% of the population
103
0.4 r---------------:::=====l
-.
-
I
"0
-..-.< 0.2
0+-----0.4 +-----+---'------+-----+-------/
o
0.1
0.2
Food concentration ([mg C] liter-I)
Fig. 4.18. Intrinsic rate of increase as function of food concentration in the Daphnia model
[Eqs. (4.14)-(4.17)], from solving the characteristic equation (Eq. (4.33) I for the maternity and
survival functions given by Eqs. (4.31) and (4.28)
Asymptotic Population Properties - Population-Specific Birth and Death
Rates. Lotka (1907) showed that the asymptotic net growth rate of the total
population can be interpreted as A. = P - 8, where p and 6 are the specific
birth and death rates of the total population after it has reached the stable
age distribution (both in units of day-'). As shown in Appendix AS, the
specific birth rate (fJ) orresponding to a given net population growth rate
(...:I.) is determined by the survival function l(x) alone:
(4.34)
When phas been computed for a given A., the specific death rate (b) of this
stable age distnbution can be calculated simply as the difference 6 = P - A..
Figure 4.19 shows that the specific birth rate P is linearly related to the
intrinsic rate of increase for A. > 0, and decreases asymptotically to zero as A.
becomes progressively more negative. At saturating food levels, the specific
death rate 6' = 0.0196 day-', so that approximately 2% of the population