

90
Herbivores and Algae: Food Utilization, Growth and Reproduction ...
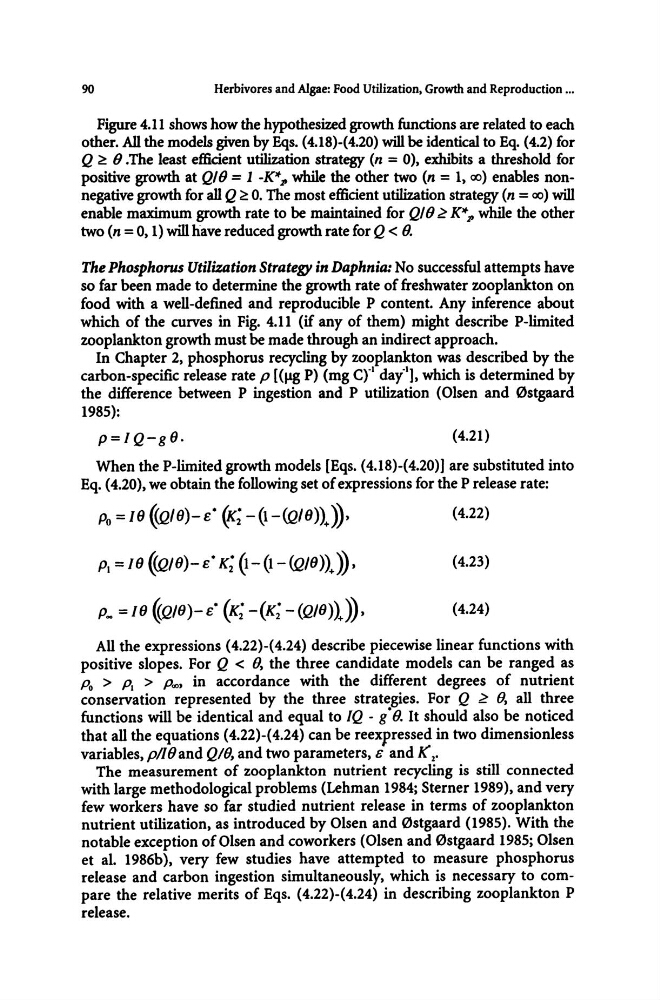
Figure 4.11 shows how the hypothesized growth functions are related to each
other. All the models given by Eqs. (4.18)-(4.20) will be identical to Eq. (4.2) for
Q ~ 0 .The least efficient utilization strategy (n = 0), exhibits a threshold for
positive growth at QIO = 1 -K*J' while the other two (n = 1,00) enables nonnegative growth for all Q ~ O. The most efficient utilization strategy (n = 00) will
enable maximum growth rate to be maintained for QIO ~ K*J' while the other
two (n = 0, 1) will have reduced growth rate for Q < O.
The Phosphorus Utilization Strategy in Daphnia: No successful attempts have
so far been made to determine the growth rate of freshwater zooplankton on
food with a well-defined and reproducible P content. Any inference about
which of the curves in Fig. 4.11 (if any of them) might describe P-limited
zooplankton growth must be made through an indirect approach.
In Chapter 2, phosphorus recycling by zooplankton was described by the
carbon-specific release rate p [(Ilg P) (mg ct day"I], which is determined by
the difference between P ingestion and P utilization (Olsen and 0stgaard
1985):
p=IQ-g6.
(4.21)
When the P-limited growth models [Eqs. (4.18)-(4.20)] are substituted into
Eq. (4.20), we obtain the following set of expressions for the P release rate:
Po = 16 (Q16)- e" (K; - (1-(Q16)t)),
PI = 16 (Q/6)- e" K; (1- (1- (Q/6).)),
P~ =16 ~Q/6)-e" (K; -(K; -(Q/6))J),
(4.22)
(4.23)
(4.24)
All the expressions (4.22)-(4.24) describe piecewise linear functions with
positive slopes. For Q < 0, the three candidate models can be ranged as
Po > PI > P.n, in accordance with the different degrees of nutrient
conservation represented by the three strategies. For Q ~ 0, all three
functions will be identical and equal to /Q - g" O. It should also be noticed
that all the equations (4.22)-(4.24) can be reexpressed in two dimensionless
variables, pl/Oand QIO, and two parameters, & and K 2 •
The measurement of zooplankton nutrient recycling is still connected
with large methodological problems (Lehman 1984; Sterner 1989), and very
few workers have so far studied nutrient release in terms of zooplankton
nutrient utilization, as introduced by Olsen and 0stgaard (1985). With the
notable exception of Olsen and coworkers (Olsen and 0stgaard 1985; Olsen
et aI. 1986b), very few studies have attempted to measure phosphorus
release and carbon ingestion simultaneously, which is necessary to compare the relative merits of Eqs. (4.22)-(4.24) in describing zooplankton P
release.
Herbivores and Algae: Food Utilization, Growth and Reproduction ...
Figure 4.11 shows how the hypothesized growth functions are related to each
other. All the models given by Eqs. (4.18)-(4.20) will be identical to Eq. (4.2) for
Q ~ 0 .The least efficient utilization strategy (n = 0), exhibits a threshold for
positive growth at QIO = 1 -K*J' while the other two (n = 1,00) enables nonnegative growth for all Q ~ O. The most efficient utilization strategy (n = 00) will
enable maximum growth rate to be maintained for QIO ~ K*J' while the other
two (n = 0, 1) will have reduced growth rate for Q < O.
The Phosphorus Utilization Strategy in Daphnia: No successful attempts have
so far been made to determine the growth rate of freshwater zooplankton on
food with a well-defined and reproducible P content. Any inference about
which of the curves in Fig. 4.11 (if any of them) might describe P-limited
zooplankton growth must be made through an indirect approach.
In Chapter 2, phosphorus recycling by zooplankton was described by the
carbon-specific release rate p [(Ilg P) (mg ct day"I], which is determined by
the difference between P ingestion and P utilization (Olsen and 0stgaard
1985):
p=IQ-g6.
(4.21)
When the P-limited growth models [Eqs. (4.18)-(4.20)] are substituted into
Eq. (4.20), we obtain the following set of expressions for the P release rate:
Po = 16 (Q16)- e" (K; - (1-(Q16)t)),
PI = 16 (Q/6)- e" K; (1- (1- (Q/6).)),
P~ =16 ~Q/6)-e" (K; -(K; -(Q/6))J),
(4.22)
(4.23)
(4.24)
All the expressions (4.22)-(4.24) describe piecewise linear functions with
positive slopes. For Q < 0, the three candidate models can be ranged as
Po > PI > P.n, in accordance with the different degrees of nutrient
conservation represented by the three strategies. For Q ~ 0, all three
functions will be identical and equal to /Q - g" O. It should also be noticed
that all the equations (4.22)-(4.24) can be reexpressed in two dimensionless
variables, pl/Oand QIO, and two parameters, & and K 2 •
The measurement of zooplankton nutrient recycling is still connected
with large methodological problems (Lehman 1984; Sterner 1989), and very
few workers have so far studied nutrient release in terms of zooplankton
nutrient utilization, as introduced by Olsen and 0stgaard (1985). With the
notable exception of Olsen and coworkers (Olsen and 0stgaard 1985; Olsen
et aI. 1986b), very few studies have attempted to measure phosphorus
release and carbon ingestion simultaneously, which is necessary to compare the relative merits of Eqs. (4.22)-(4.24) in describing zooplankton P
release.