

140
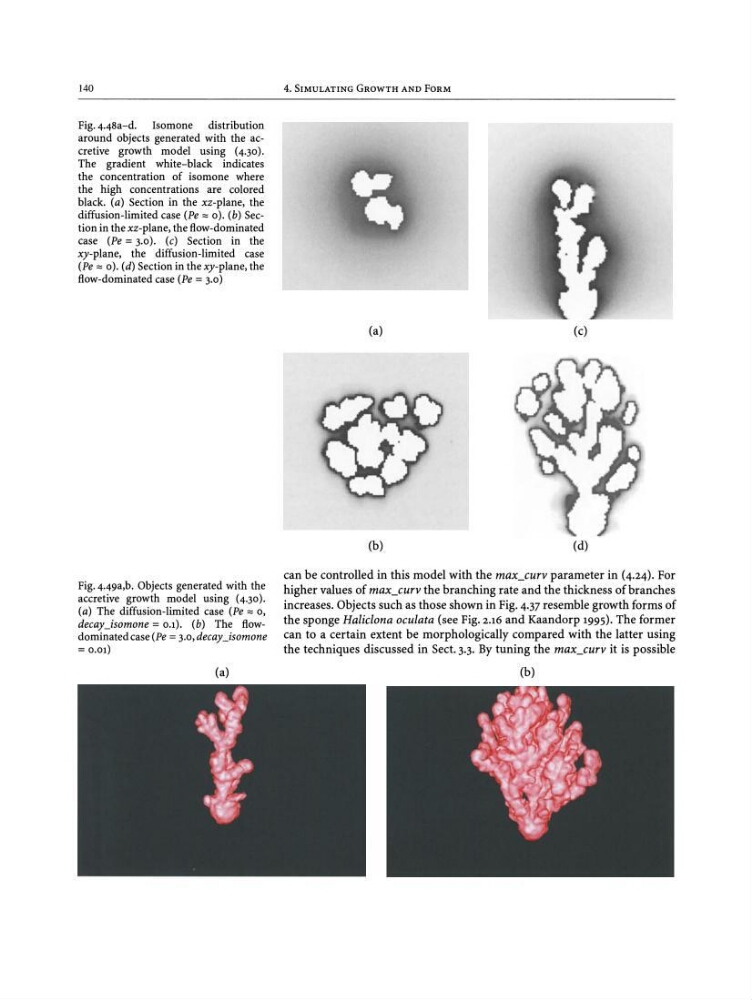
Fig.4.48a-d. Isomone distribution
around objects generated with the accretive growth model using (4.30).
The gradient white-black indicates
the concentration of isomone where
the high concentrations are colored
black. (a) Section in the xz-plane, the
diffusion-limited case (Pe :::: 0). (b) Section in the xz-plane, the flow-dominated
case iPe > 3.0). (c) Section in the
xy-plane, the diffusion-limited case
(Pe :::: 0). (d) Section in the xy-plane , the
flow-dominatedcase (Pe = 3.0)
4. SIMULATING GROWTH AND FORM
(a)
(b)
(c)
(d)
Fig.4-49a,b. Objects generated with the
accretive growth model using (4.30).
(a) The diffusion-limited case (Pe:::: 0,
decay_isomone = 0.1). (b) The flowdominated case(Pe = 3.0,decay_isomone
=0.01)
(a)
can be controlled in this model with the max_curv parameter in (4.24). For
higher values of max_curv the branching rate and the thickness of branches
increases. Objects such as those shown in Fig. 4.37 resemble growth forms of
the sponge Haliclona oculata (see Fig. 2.16 and Kaandorp 1995). The former
can to a certain extent be morphologically compared with the latter using
the techniques discussed in Sect. 3.3. By tuning the max_curv it is possible
(b)
Fig.4.48a-d. Isomone distribution
around objects generated with the accretive growth model using (4.30).
The gradient white-black indicates
the concentration of isomone where
the high concentrations are colored
black. (a) Section in the xz-plane, the
diffusion-limited case (Pe :::: 0). (b) Section in the xz-plane, the flow-dominated
case iPe > 3.0). (c) Section in the
xy-plane, the diffusion-limited case
(Pe :::: 0). (d) Section in the xy-plane , the
flow-dominatedcase (Pe = 3.0)
4. SIMULATING GROWTH AND FORM
(a)
(b)
(c)
(d)
Fig.4-49a,b. Objects generated with the
accretive growth model using (4.30).
(a) The diffusion-limited case (Pe:::: 0,
decay_isomone = 0.1). (b) The flowdominated case(Pe = 3.0,decay_isomone
=0.01)
(a)
can be controlled in this model with the max_curv parameter in (4.24). For
higher values of max_curv the branching rate and the thickness of branches
increases. Objects such as those shown in Fig. 4.37 resemble growth forms of
the sponge Haliclona oculata (see Fig. 2.16 and Kaandorp 1995). The former
can to a certain extent be morphologically compared with the latter using
the techniques discussed in Sect. 3.3. By tuning the max_curv it is possible
(b)