

4.6. ACCRETIVE GROWTH
137
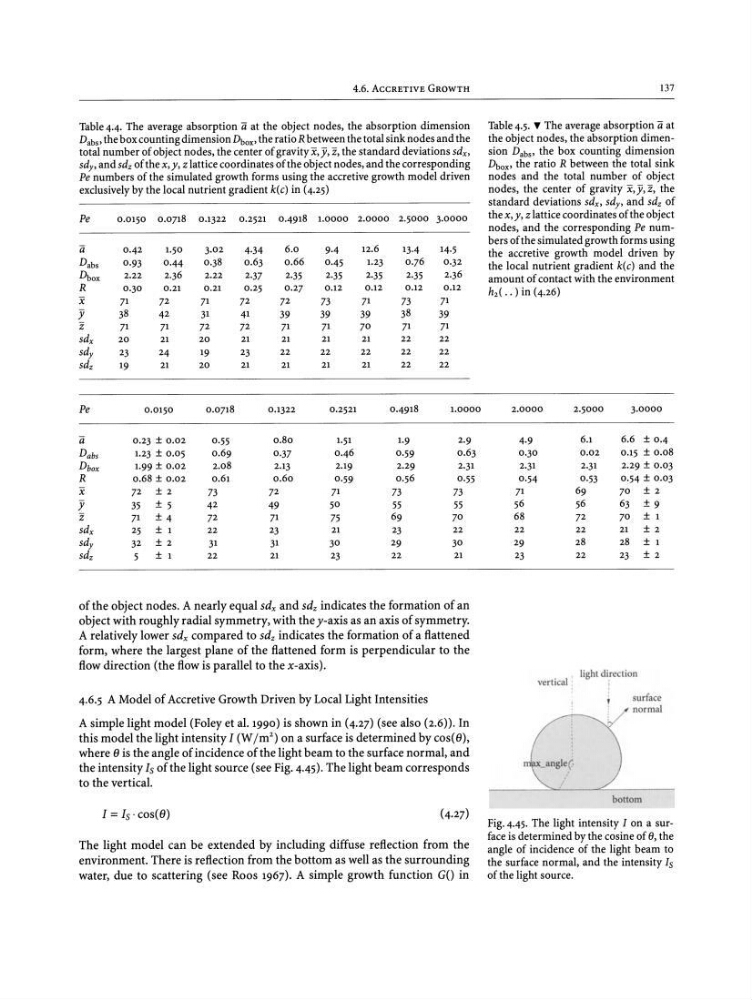
Table4.4. The average absorption Ii at the object nodes, the absorption dimension
Table4.5. T The average absorption Ii at
D abs' the box counting dimension ~ox, the ratio R between the total sink nodes and the
the object nodes, the absorption dimentotal number of object nodes, the center of gravity X, y,z, the stand ard deviations sd-; sion D abs' the box counting dimension
sdy, and sd; of the x,y, z lattice coordinates of the object nodes, and the corresponding
~ox , the ratio R between the total sink
Pe numbers of the simulated growth forms using the accretive growth model driven
nodes and the total number of object
exclusively by the local nutrient gradient k(c) in (4.25)
nodes, the center of gravity X,y,Z, the
standard deviations sd-, sdy, and sd; of
Pe
0 .0150 0 .0718 0.1322 0.2521 0.4918 1.0000 2.0000 2·5000 3·0000
the x, y, z lattice coordinates of the object
nodes, and the corresponding Pe numIi
0·42
1.50
3.0 2
4·34
6.0
9-4
12.6
13-4
14·5
bers of the simulated growth forms using
the accretive growth model driven by
Dab s
0·93
0·44
0 ·38
0.63
0 .66
0·45
1.23
0.76
0 ·32
the local nutrient gradient k(c) and the
Db ox
2.22
2.36
2.22
2·37
2·35
2·35
2·35
2·35
2.36
amount of contact with the environment
R
0 ·30
0 .21
0.21
0.25
0.27
0.12
0 .12
0.12
0.12
h 2 ( • • ) in (4.26)
x
71
72
71
72
72
73
71
73
71
Y
38
42
31
41
39
39
39
38
39
z
71
71
72
72
71
71
70
71
71
sd;
20
21
20
21
21
21
21
22
22
sd,
23
24
19
23
22
22
22
22
22
sd;
19
21
20
21
21
21
21
22
22
Pe
0.0150
0.0718
0.1322
0 .2521
0.4918
1.0000
2.0000
2.50 00
3·0000
Ii
0.23 ± 0 .02
0·55
0.80
1.51
1.9
2·9
4·9
6.1
6.6 ± 0·4
D abs
1.23 ± 0 .05
0.69
0 ·37
0 .46
0·59
0 .63
0·30
0.02
0 .15 ± 0 .08
D box
1.99 ± 0 .02
2.0 8
2.13
2.19
2.29
2·31
2·31
2·31
2.29 ± 0.03
R
0 .68 ± 0 .02
0.61
0.60
0·59
0·56
0 ·55
0 ·54
0 ·53
0.54 ± 0.03
X
72 ± 2
73
7 2
71
73
73
71
69
70 ± 2
Y
35
± 5
42
49
50
55
55
56
56
63 ±9
z
71 ±4
72
71
75
69
70
68
72
70 ± 1
sd;
25 ± 1
22
23
21
23
22
22
22
21 ± 2
sdy
3 2 ± 2
31
31
30
29
30
29
28
28 ± 1
sd;
5
± 1
22
21
23
22
21
23
22
23 ± 2
of the object nodes. A nearly equal sd; and sd, indicates the formation of an
object with roughly radial symmetry, with the y-axis as an axis of symmetry.
A relatively lower sd; compared to sd, indicates the formation of a flattened
form, where the largest plane of the flattened form is perpendicular to the
flow direction (the flow is parallel to the x-axis).
4.6.5 A Model of Accretive Growth Driven by Local Light Intensities
A simple light model (Foley et al. 1990) is shown in (4.27) (see also (2.6». In
this model the light intensity I (W1m
2
) on a surface is determined by costs),
where 8 is the angle of incidence of the light beam to the surface normal, and
the intensity Is of the light source (see Fig. 4.45). The light beam corresponds
to the vertical.
vert ical
light di,rcction
,
surface
, normal
bottom
I = Is ' cos(8)
The light model can be extended by including diffuse reflection from the
environment. There is reflection from the bottom as well as the surrounding
water, due to scattering (see Roos 1967). A simple growth function GO in
Fig.4.45. The light intensity I on a surface is determined by the cosine of e, the
angle of incidence of the light beam to
the surface normal, and the intensity Is
of the light source.
137
Table4.4. The average absorption Ii at the object nodes, the absorption dimension
Table4.5. T The average absorption Ii at
D abs' the box counting dimension ~ox, the ratio R between the total sink nodes and the
the object nodes, the absorption dimentotal number of object nodes, the center of gravity X, y,z, the stand ard deviations sd-; sion D abs' the box counting dimension
sdy, and sd; of the x,y, z lattice coordinates of the object nodes, and the corresponding
~ox , the ratio R between the total sink
Pe numbers of the simulated growth forms using the accretive growth model driven
nodes and the total number of object
exclusively by the local nutrient gradient k(c) in (4.25)
nodes, the center of gravity X,y,Z, the
standard deviations sd-, sdy, and sd; of
Pe
0 .0150 0 .0718 0.1322 0.2521 0.4918 1.0000 2.0000 2·5000 3·0000
the x, y, z lattice coordinates of the object
nodes, and the corresponding Pe numIi
0·42
1.50
3.0 2
4·34
6.0
9-4
12.6
13-4
14·5
bers of the simulated growth forms using
the accretive growth model driven by
Dab s
0·93
0·44
0 ·38
0.63
0 .66
0·45
1.23
0.76
0 ·32
the local nutrient gradient k(c) and the
Db ox
2.22
2.36
2.22
2·37
2·35
2·35
2·35
2·35
2.36
amount of contact with the environment
R
0 ·30
0 .21
0.21
0.25
0.27
0.12
0 .12
0.12
0.12
h 2 ( • • ) in (4.26)
x
71
72
71
72
72
73
71
73
71
Y
38
42
31
41
39
39
39
38
39
z
71
71
72
72
71
71
70
71
71
sd;
20
21
20
21
21
21
21
22
22
sd,
23
24
19
23
22
22
22
22
22
sd;
19
21
20
21
21
21
21
22
22
Pe
0.0150
0.0718
0.1322
0 .2521
0.4918
1.0000
2.0000
2.50 00
3·0000
Ii
0.23 ± 0 .02
0·55
0.80
1.51
1.9
2·9
4·9
6.1
6.6 ± 0·4
D abs
1.23 ± 0 .05
0.69
0 ·37
0 .46
0·59
0 .63
0·30
0.02
0 .15 ± 0 .08
D box
1.99 ± 0 .02
2.0 8
2.13
2.19
2.29
2·31
2·31
2·31
2.29 ± 0.03
R
0 .68 ± 0 .02
0.61
0.60
0·59
0·56
0 ·55
0 ·54
0 ·53
0.54 ± 0.03
X
72 ± 2
73
7 2
71
73
73
71
69
70 ± 2
Y
35
± 5
42
49
50
55
55
56
56
63 ±9
z
71 ±4
72
71
75
69
70
68
72
70 ± 1
sd;
25 ± 1
22
23
21
23
22
22
22
21 ± 2
sdy
3 2 ± 2
31
31
30
29
30
29
28
28 ± 1
sd;
5
± 1
22
21
23
22
21
23
22
23 ± 2
of the object nodes. A nearly equal sd; and sd, indicates the formation of an
object with roughly radial symmetry, with the y-axis as an axis of symmetry.
A relatively lower sd; compared to sd, indicates the formation of a flattened
form, where the largest plane of the flattened form is perpendicular to the
flow direction (the flow is parallel to the x-axis).
4.6.5 A Model of Accretive Growth Driven by Local Light Intensities
A simple light model (Foley et al. 1990) is shown in (4.27) (see also (2.6». In
this model the light intensity I (W1m
2
) on a surface is determined by costs),
where 8 is the angle of incidence of the light beam to the surface normal, and
the intensity Is of the light source (see Fig. 4.45). The light beam corresponds
to the vertical.
vert ical
light di,rcction
,
surface
, normal
bottom
I = Is ' cos(8)
The light model can be extended by including diffuse reflection from the
environment. There is reflection from the bottom as well as the surrounding
water, due to scattering (see Roos 1967). A simple growth function GO in
Fig.4.45. The light intensity I on a surface is determined by the cosine of e, the
angle of incidence of the light beam to
the surface normal, and the intensity Is
of the light source.