

4.6. ACCRETIVE GROWTH
the environment in an object with radiate accretive growth can be related to
the local radius of curvature, where a relatively high local radius of curvature indicates a relatively low access to the environment. In Sect. 4.6.3we will
briefly discuss the geometric model and the estimation of the local amount of
contact with environment; more details can be found elsewhere (Kaandorp
1994a, 1994b and 1995). Although the growth function, using an approximation of growth velocities, does not provide much insight into the actual
growth process, the branching patterns produced with this model demonstrate several important aspects of the branching process. These aspects will
be discussed in more detail in Sect. 4.6.7, when the models are compared to
the actual growth forms.
In the second model, described in Sect. 4.6.4, the growth function in the
accretive growth model consists of a component in which an estimation is
made of the local amount of available nutrient in the environment combined
with the effect of the local amount of contact with the environment. In the
first component the distribution of suspended food particles due to a combination of flow, diffusion, and absorption at the growth form is modeled.
The underlying method for modeling nutrient distributions is the lattice
Boltzmann method, combined with a tracer step to study the transport process. The nutrient distributions are computed using this method for various
Peclet numbers. This method is discussed in Sect. 4.5.2 and Sect. 4.3-1. With
this model it is possible to study the morphologies which develop in an accretive growth process, exclusively driven by the availability of simulated food
particles and the influence of hydrodynamics on the distribution of food particles. More detailed accounts of the coupling of the accretive growth model
and the nutrient model are provided elsewhere (Kaandorp and Sloot 1997
and Kaandorp and Sloot 2001).
In the third model, presented in Sect. 4.6.5, the growth function in the
accretive growth model consists of a component making an estimation of
the local available (simulated) light intensity, combined with the effect of
the local amount of contact with the environment. With this model accretive
growth driven by the availability of light can be studied.
Finally a simple and preliminary model will be shown in Sect. 4.6.6,
where a nutrient driven growth process, as discussed in Sect. 4.6.4, is regulated by a simulated chemical agent. In this model the growth function
consists of three components: in the first component an estimation is made
of the local amount of available nutrient in the environment, in the second
component an estimation is made of the local amount of growth suppressor
(the "isomone"), and in the third component the amount of contact with the
environment is approximated.
4.6.2 A Model of Surface Normal Accretive Growth
In the accretive growth model we have used a three-dimensional geometrical
model. The different growth layers in this model are represented by layers of
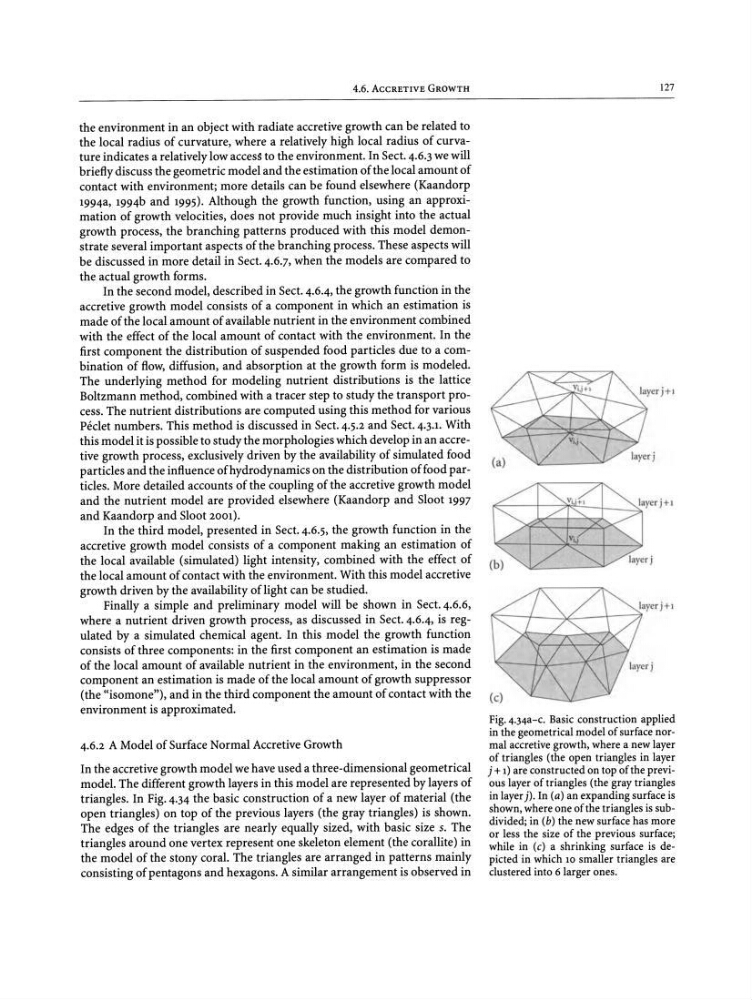
triangles. In Fig. 4.34 the basic construction of a new layer of material (the
open triangles) on top of the previous layers (the gray triangles) is shown.
The edges of the triangles are nearly equally sized, with basic size s. The
triangles around one vertex represent one skeleton element (the corallite) in
the model of the stony coral. The triangles are arranged in patterns mainly
consisting of pentagons and hexagons. A similar arrangement is observed in
127
Fig. 4.34a-c. Basic construction applied
in the geometrical model of surface normal accretive growth , where a new layer
of triangles (the open triangles in layer
j + 1) are constructed on top of the previous layer of triangles (the gray triangles
in layerj). In (a) an expanding surface is
shown, where one of the triangles is subdivided; in (b) the new surface has more
or less the size of the previous surface;
while in (c) a shrinking surface is depicted in which 10 smaller triangles are
clustered into 6 larger ones.
the environment in an object with radiate accretive growth can be related to
the local radius of curvature, where a relatively high local radius of curvature indicates a relatively low access to the environment. In Sect. 4.6.3we will
briefly discuss the geometric model and the estimation of the local amount of
contact with environment; more details can be found elsewhere (Kaandorp
1994a, 1994b and 1995). Although the growth function, using an approximation of growth velocities, does not provide much insight into the actual
growth process, the branching patterns produced with this model demonstrate several important aspects of the branching process. These aspects will
be discussed in more detail in Sect. 4.6.7, when the models are compared to
the actual growth forms.
In the second model, described in Sect. 4.6.4, the growth function in the
accretive growth model consists of a component in which an estimation is
made of the local amount of available nutrient in the environment combined
with the effect of the local amount of contact with the environment. In the
first component the distribution of suspended food particles due to a combination of flow, diffusion, and absorption at the growth form is modeled.
The underlying method for modeling nutrient distributions is the lattice
Boltzmann method, combined with a tracer step to study the transport process. The nutrient distributions are computed using this method for various
Peclet numbers. This method is discussed in Sect. 4.5.2 and Sect. 4.3-1. With
this model it is possible to study the morphologies which develop in an accretive growth process, exclusively driven by the availability of simulated food
particles and the influence of hydrodynamics on the distribution of food particles. More detailed accounts of the coupling of the accretive growth model
and the nutrient model are provided elsewhere (Kaandorp and Sloot 1997
and Kaandorp and Sloot 2001).
In the third model, presented in Sect. 4.6.5, the growth function in the
accretive growth model consists of a component making an estimation of
the local available (simulated) light intensity, combined with the effect of
the local amount of contact with the environment. With this model accretive
growth driven by the availability of light can be studied.
Finally a simple and preliminary model will be shown in Sect. 4.6.6,
where a nutrient driven growth process, as discussed in Sect. 4.6.4, is regulated by a simulated chemical agent. In this model the growth function
consists of three components: in the first component an estimation is made
of the local amount of available nutrient in the environment, in the second
component an estimation is made of the local amount of growth suppressor
(the "isomone"), and in the third component the amount of contact with the
environment is approximated.
4.6.2 A Model of Surface Normal Accretive Growth
In the accretive growth model we have used a three-dimensional geometrical
model. The different growth layers in this model are represented by layers of
triangles. In Fig. 4.34 the basic construction of a new layer of material (the
open triangles) on top of the previous layers (the gray triangles) is shown.
The edges of the triangles are nearly equally sized, with basic size s. The
triangles around one vertex represent one skeleton element (the corallite) in
the model of the stony coral. The triangles are arranged in patterns mainly
consisting of pentagons and hexagons. A similar arrangement is observed in
127
Fig. 4.34a-c. Basic construction applied
in the geometrical model of surface normal accretive growth , where a new layer
of triangles (the open triangles in layer
j + 1) are constructed on top of the previous layer of triangles (the gray triangles
in layerj). In (a) an expanding surface is
shown, where one of the triangles is subdivided; in (b) the new surface has more
or less the size of the previous surface;
while in (c) a shrinking surface is depicted in which 10 smaller triangles are
clustered into 6 larger ones.