

4.5. GROWTH BY AGGREGATION
In Figs. 4.30, 4.31, and 4.32, the three-dimensional morphology of the
aggregates is visualized in combination with the corresponding nutrient
distribution. The color shift from white to red in the aggregates indicates
which parts of the aggregate are added most recently on top of the previous
growth stage: red indicates the "oldest" part of the growth form in Fig. 4.30 ,
while (for visualization reasons) the youngest parts of the aggregate are
shown in white in Fig. 4.31.The nutrient distribution is depicted using a color
shift from blue to white, where blue indicates the highest concentration and
white the lowest. In Figs. 4.30 and 4.31 the nutrient distribution is shown
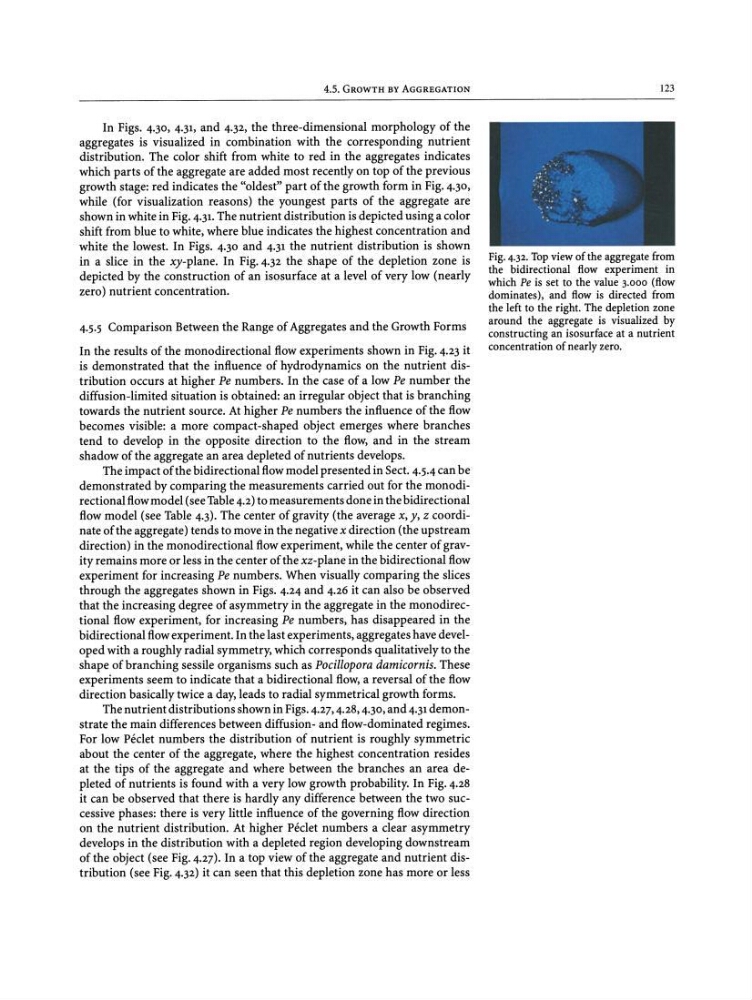
in a slice in the xy-plane. In Fig. 4.32 the shape of the depletion zone is
depicted by the construction of an isosurface at a level of very low (nearly
zero) nutrient concentration.
4.5.5 Comparison Between the Range of Aggregates and the Growth Forms
In the results of the monodirectional flow experiments shown in Fig. 4.23 it
is demonstrated that the influence of hydrodynamics on the nutrient distribution occurs at higher Pe numbers. In the case of a low Pe number the
diffusion-limited situation is obtained: an irregular object that is branching
towards the nutrient source. At higher Pe numbers the influence of the flow
becomes visible: a more compact-shaped object emerges where branches
tend to develop in the opposite direction to the flow, and in the stream
shadow of the aggregate an area depleted of nutrients develops.
The impact of the bidirectional flowmodel presented in Sect. 4.5.4 can be
demonstrated by comparing the measurements carried out for the monodirectional flowmodel (see Table4.2) to measurements done in the bidirectional
flow model (see Table 4.3). The center of gravity (the average x, y, z coordinate of the aggregate) tends to move in the negative x direction (the upstream
direction) in the monodirectional flow experiment, while the center of gravity remains more or less in the center of the xz-plane in the bidirectional flow
experiment for increasing Pe numbers. When visually comparing the slices
through the aggregates shown in Figs. 4.24 and 4.26 it can also be observed
that the increasing degree of asymmetry in the aggregate in the monodirectional flow experiment, for increasing Pe numbers, has disappeared in the
bidirectional flowexperiment. In the last experiments, aggregates have developed with a roughly radial symmetry, which corresponds qualitatively to the
shape of branching sessile organisms such as Pocillopora damicornis. These
experiments seem to indicate that a bidirectional flow, a reversal of the flow
direction basically twice a day, leads to radial symmetrical growth forms.
The nutrient distributions shown in Figs.4.27, 4.28, 4.30, and 4.31demonstrate the main differences between diffusion- and flow-dominated regimes.
For low Peeler numbers the distribution of nutrient is roughly symmetric
about the center of the aggregate, where the highest concentration resides
at the tips of the aggregate and where between the branches an area depleted of nutrients is found with a very low growth probability. In Fig. 4.28
it can be observed that there is hardly any difference between the two successive phases: there is very little influence of the governing flow direction
on the nutrient distribution. At higher Peeler numbers a elear asymmetry
develops in the distribution with a depleted region developing downstream
of the object (see Fig. 4.27). In a top view of the aggregate and nutrient distribution (see Fig. 4.32) it can seen that this depletion zone has more or less
123
Fig. 4.32.Top viewof the aggregate from
the bidirectional flow experiment in
which Pe is set to the value 3.000 (flow
dominates), and flow is directed from
the left to the right. The depletion zone
around the aggregate is visualized by
constructing an isosurface at a nutrient
concentration of nearly zero.
In Figs. 4.30, 4.31, and 4.32, the three-dimensional morphology of the
aggregates is visualized in combination with the corresponding nutrient
distribution. The color shift from white to red in the aggregates indicates
which parts of the aggregate are added most recently on top of the previous
growth stage: red indicates the "oldest" part of the growth form in Fig. 4.30 ,
while (for visualization reasons) the youngest parts of the aggregate are
shown in white in Fig. 4.31.The nutrient distribution is depicted using a color
shift from blue to white, where blue indicates the highest concentration and
white the lowest. In Figs. 4.30 and 4.31 the nutrient distribution is shown
in a slice in the xy-plane. In Fig. 4.32 the shape of the depletion zone is
depicted by the construction of an isosurface at a level of very low (nearly
zero) nutrient concentration.
4.5.5 Comparison Between the Range of Aggregates and the Growth Forms
In the results of the monodirectional flow experiments shown in Fig. 4.23 it
is demonstrated that the influence of hydrodynamics on the nutrient distribution occurs at higher Pe numbers. In the case of a low Pe number the
diffusion-limited situation is obtained: an irregular object that is branching
towards the nutrient source. At higher Pe numbers the influence of the flow
becomes visible: a more compact-shaped object emerges where branches
tend to develop in the opposite direction to the flow, and in the stream
shadow of the aggregate an area depleted of nutrients develops.
The impact of the bidirectional flowmodel presented in Sect. 4.5.4 can be
demonstrated by comparing the measurements carried out for the monodirectional flowmodel (see Table4.2) to measurements done in the bidirectional
flow model (see Table 4.3). The center of gravity (the average x, y, z coordinate of the aggregate) tends to move in the negative x direction (the upstream
direction) in the monodirectional flow experiment, while the center of gravity remains more or less in the center of the xz-plane in the bidirectional flow
experiment for increasing Pe numbers. When visually comparing the slices
through the aggregates shown in Figs. 4.24 and 4.26 it can also be observed
that the increasing degree of asymmetry in the aggregate in the monodirectional flow experiment, for increasing Pe numbers, has disappeared in the
bidirectional flowexperiment. In the last experiments, aggregates have developed with a roughly radial symmetry, which corresponds qualitatively to the
shape of branching sessile organisms such as Pocillopora damicornis. These
experiments seem to indicate that a bidirectional flow, a reversal of the flow
direction basically twice a day, leads to radial symmetrical growth forms.
The nutrient distributions shown in Figs.4.27, 4.28, 4.30, and 4.31demonstrate the main differences between diffusion- and flow-dominated regimes.
For low Peeler numbers the distribution of nutrient is roughly symmetric
about the center of the aggregate, where the highest concentration resides
at the tips of the aggregate and where between the branches an area depleted of nutrients is found with a very low growth probability. In Fig. 4.28
it can be observed that there is hardly any difference between the two successive phases: there is very little influence of the governing flow direction
on the nutrient distribution. At higher Peeler numbers a elear asymmetry
develops in the distribution with a depleted region developing downstream
of the object (see Fig. 4.27). In a top view of the aggregate and nutrient distribution (see Fig. 4.32) it can seen that this depletion zone has more or less
123
Fig. 4.32.Top viewof the aggregate from
the bidirectional flow experiment in
which Pe is set to the value 3.000 (flow
dominates), and flow is directed from
the left to the right. The depletion zone
around the aggregate is visualized by
constructing an isosurface at a nutrient
concentration of nearly zero.