

4.5. GROWTH BY AGGREGATION
(a)
117
(b)
(c)
aggregate. The probability p that k, an element from the set of open circles °
(the adjacent sink nodes), will be added to the set of black circles (the
aggregate nodes) is given by:
p(k E 0--7 k Ee) = (ak)
(4.18)
Ljeo(aj)
where ak is the absorbed number of tracer particles at position k.
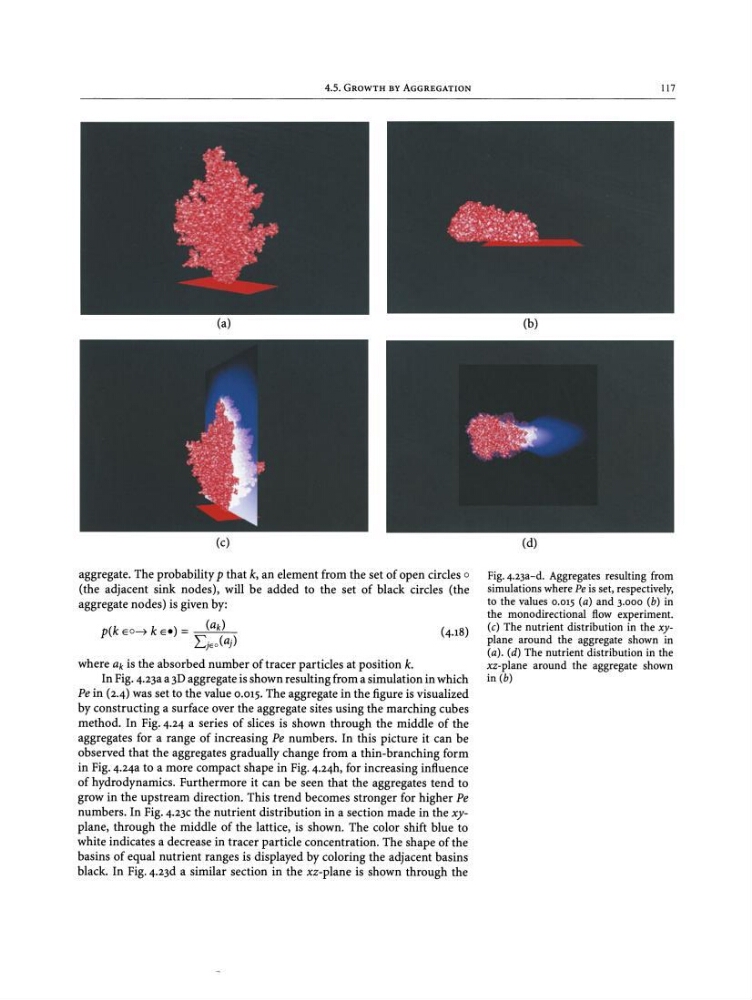
In Fig. 4.23aa 3D aggregate is shown resulting from a simulation in which
Pe in (2.4) was set to the value 0.015. The aggregate in the figure is visualized
by constructing a surface over the aggregate sites using the marching cubes
method. In Fig. 4.24 a series of slices is shown through the middle of the
aggregates for a range of increasing Pe numbers. In this picture it can be
observed that the aggregates gradually change from a thin-branching form
in Fig. 4.24a to a more compa ct shape in Fig. 4.24h, for increasing influence
of hydrodynamics. Furthermore it can be seen that the aggregates tend to
grow in the upstream direction. This trend becomes stronger for higher Pe
numbers. In Fig. 4.23C the nutrient distribution in a section made in the xyplane, through the middle of the lattice, is shown . The color shift blue to
white indicates a decrease in tracer particle concentration. The shape of the
basins of equal nutrient ranges is displayed by coloring the adjacent basins
black. In Fig.4.23d a similar section in the xz-plane is shown through the
(d)
Fig.4.23a-d. Aggregates resulting from
simulation s where Pe is set, respectively,
to the values 0.015 (a) and 3.000 (b) in
the monodirectional flow experiment.
(e) The nutrient distribution in the xyplane around the aggregate shown in
(a). (d) The nutrient distribution in the
xz-plane around the aggregate shown
in (b)
(a)
117
(b)
(c)
aggregate. The probability p that k, an element from the set of open circles °
(the adjacent sink nodes), will be added to the set of black circles (the
aggregate nodes) is given by:
p(k E 0--7 k Ee) = (ak)
(4.18)
Ljeo(aj)
where ak is the absorbed number of tracer particles at position k.
In Fig. 4.23aa 3D aggregate is shown resulting from a simulation in which
Pe in (2.4) was set to the value 0.015. The aggregate in the figure is visualized
by constructing a surface over the aggregate sites using the marching cubes
method. In Fig. 4.24 a series of slices is shown through the middle of the
aggregates for a range of increasing Pe numbers. In this picture it can be
observed that the aggregates gradually change from a thin-branching form
in Fig. 4.24a to a more compa ct shape in Fig. 4.24h, for increasing influence
of hydrodynamics. Furthermore it can be seen that the aggregates tend to
grow in the upstream direction. This trend becomes stronger for higher Pe
numbers. In Fig. 4.23C the nutrient distribution in a section made in the xyplane, through the middle of the lattice, is shown . The color shift blue to
white indicates a decrease in tracer particle concentration. The shape of the
basins of equal nutrient ranges is displayed by coloring the adjacent basins
black. In Fig.4.23d a similar section in the xz-plane is shown through the
(d)
Fig.4.23a-d. Aggregates resulting from
simulation s where Pe is set, respectively,
to the values 0.015 (a) and 3.000 (b) in
the monodirectional flow experiment.
(e) The nutrient distribution in the xyplane around the aggregate shown in
(a). (d) The nutrient distribution in the
xz-plane around the aggregate shown
in (b)