

4.4. A LAPLACIAN MODEL OF BRANCHING GROWTH
113
(a)
(c)
(b)
(d)
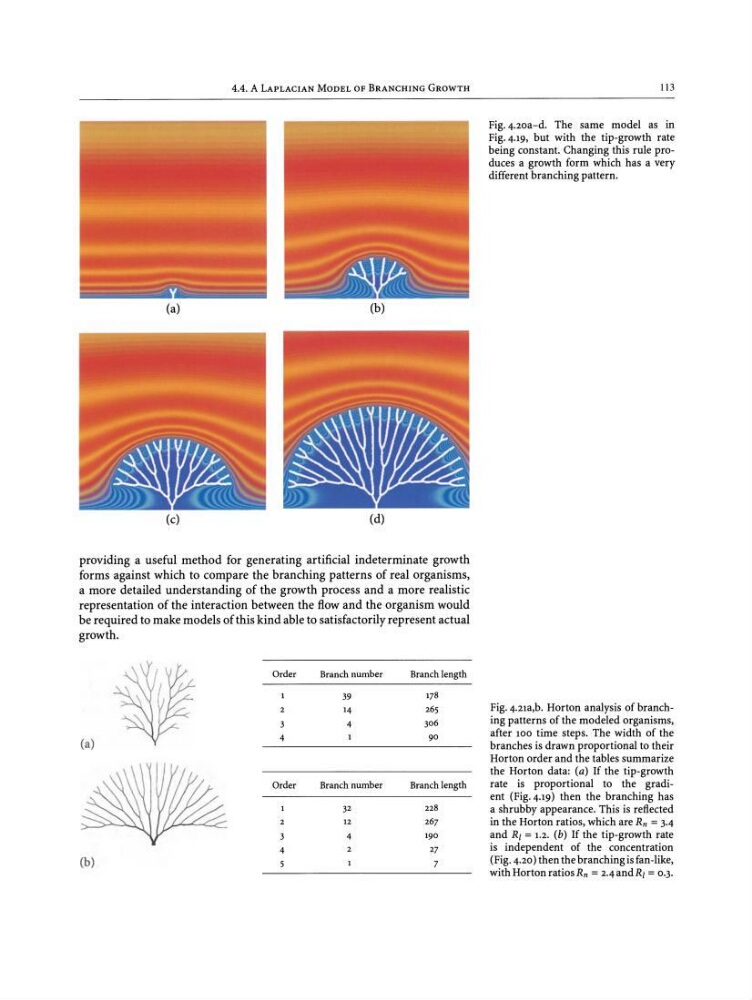
Piga.zoa-d. The same model as in
Fig. 4.19, but with the tip-growth rate
being constant. Changing this rule produces a growth form which has a very
different branching pattern.
providing a useful method for generating artificial indeterminate growth
forms against which to compare the branching patterns of real organisms,
a more detailed understanding of the growth process and a more realistic
representation of the interaction between the flow and the organism would
be required to make models of this kind able to satisfactorily represent actual
growth.
(a)
(b)
Order
2
3
4
Order
2
3
4
5
Branch number
39
14
4
Branch number
32
12
4
2
Branch length
178
265
306
90
Branch length
228
267
190
27
7
Pig.a.zra.b. Horton analysis of branching patterns of the modeled organisms,
after 100 time steps. The width of the
branches is drawn proportional to their
Horton order and the tables summarize
the Horton data : (a) If the tip-growth
rate is proportional to the gradient (Fig.4.19) then the branching has
a shrubby appearance. This is reflected
in the Horton ratios, which are R n = 3.4
and Rl = 1.2. (b) If the tip-growth rate
is independent of the concentration
(Fig. 4.20) then the branching is fan-like,
with Horton ratios Rn =2.4and Rl =0.3.
113
(a)
(c)
(b)
(d)
Piga.zoa-d. The same model as in
Fig. 4.19, but with the tip-growth rate
being constant. Changing this rule produces a growth form which has a very
different branching pattern.
providing a useful method for generating artificial indeterminate growth
forms against which to compare the branching patterns of real organisms,
a more detailed understanding of the growth process and a more realistic
representation of the interaction between the flow and the organism would
be required to make models of this kind able to satisfactorily represent actual
growth.
(a)
(b)
Order
2
3
4
Order
2
3
4
5
Branch number
39
14
4
Branch number
32
12
4
2
Branch length
178
265
306
90
Branch length
228
267
190
27
7
Pig.a.zra.b. Horton analysis of branching patterns of the modeled organisms,
after 100 time steps. The width of the
branches is drawn proportional to their
Horton order and the tables summarize
the Horton data : (a) If the tip-growth
rate is proportional to the gradient (Fig.4.19) then the branching has
a shrubby appearance. This is reflected
in the Horton ratios, which are R n = 3.4
and Rl = 1.2. (b) If the tip-growth rate
is independent of the concentration
(Fig. 4.20) then the branching is fan-like,
with Horton ratios Rn =2.4and Rl =0.3.