

168
4 Molecular Evolution
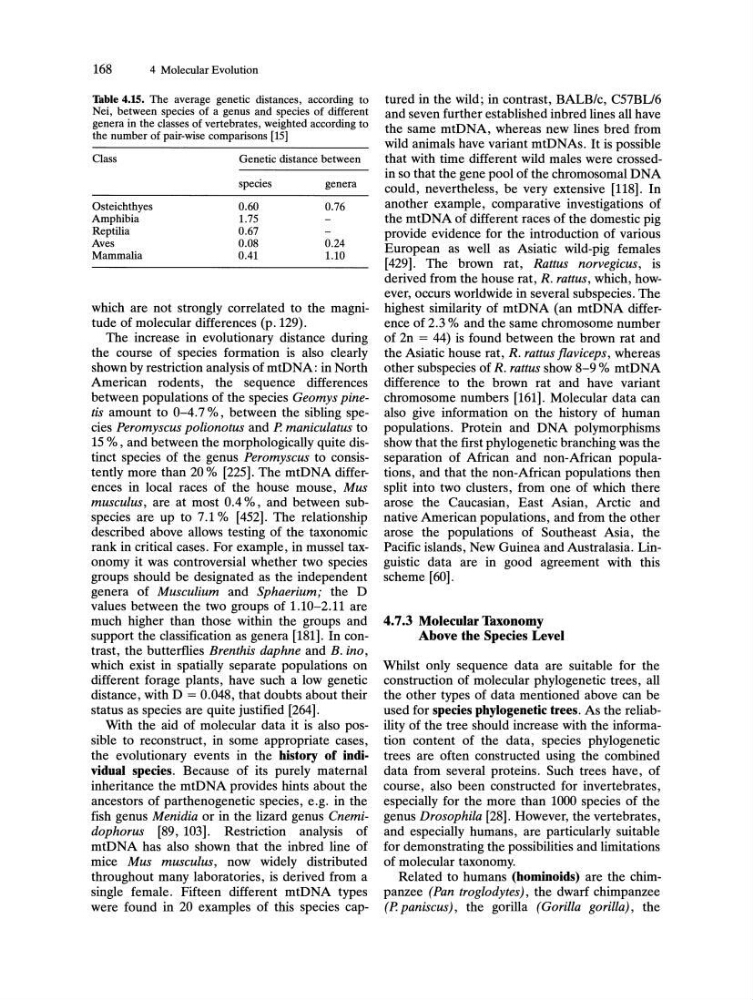
Table 4.15. The average genetic distances, according to
Nei, between species of a genus and species of different
genera in the classes of vertebrates, weighted according to
the number of pair-wise comparisons [15]
Class
Osteichthyes
Amphibia
Reptilia
Aves
Mammalia
Genetic distance between
species
genera
0.60
0.76
1.75
0.67
0.08
0.24
0.41
1.10
which are not strongly correlated to the magnitude of molecular differences (p. 129).
The increase in evolutionary distance during
the course of species formation is also clearly
shown by restriction analysis of mtDNA: in North
American rodents, the sequence differences
between populations of the species Geomys pinetis amount to 0-4.7 %, between the sibling species Peromyscus polio notus and P. maniculatus to
15 %, and between the morphologically quite distinct species of the genus Peromyscus to consistently more than 20 % [225]. The mtDNA differences in local races of the house mouse, Mus
musculus, are at most 0.4 %, and between subspecies are up to 7.1 % [452]. The relationship
described above allows testing of the taxonomic
rank in critical cases. For example, in mussel taxonomy it was controversial whether two species
groups should be designated as the independent
genera of Musculium and Sphaerium; the D
values between the two groups of 1.10-2.11 are
much higher than those within the groups and
support the classification as genera [181]. In contrast, the butterflies Brenthis daphne and B. ino,
which exist in spatially separate populations on
different forage plants, have such a low genetic
distance, with D = 0.048, that doubts about their
status as species are quite justified [264].
With the aid of molecular data it is also possible to reconstruct, in some appropriate cases,
the evolutionary events in the history of individual species. Because of its purely maternal
inheritance the mtDNA provides hints about the
ancestors of parthenogenetic species, e.g. in the
fish genus Menidia or in the lizard genus Cnemidophorus [89, 103]. Restriction analysis of
mtDNA has also shown that the inbred line of
mice Mus musculus, now widely distributed
throughout many laboratories, is derived from a
single female. Fifteen different mtDNA types
were found in 20 examples of this species captured in the wild; in contrast, BALB/c, C57BLl6
and seven further established inbred lines all have
the same mtDNA, whereas new lines bred from
wild animals have variant mtDNAs. It is possible
that with time different wild males were crossedin so that the gene pool of the chromosomal DNA
could, nevertheless, be very extensive [118]. In
another example, comparative investigations of
the mtDNA of different races of the domestic pig
provide evidence for the introduction of various
European as well as Asiatic wild-pig females
[429]. The brown rat, Rattus norvegicus, is
derived from the house rat, R. rattus, which, however, occurs worldwide in several subspecies. The
highest similarity of mtDNA (an mtDNA difference of 2.3 % and the same chromosome number
of 2n = 44) is found between the brown rat and
the Asiatic house rat, R. rattus [laviceps, whereas
other subspecies of R. rattus show 8-9 % mtDNA
difference to the brown rat and have variant
chromosome numbers [161]. Molecular data can
also give information on the history of human
populations. Protein and DNA polymorphisms
show that the first phylogenetic branching was the
separation of African and non-African populations, and that the non-African populations then
split into two clusters, from one of which there
arose the Caucasian, East Asian, Arctic and
native American populations, and from the other
arose the populations of Southeast Asia, the
Pacific islands, New Guinea and Australasia. Linguistic data are in good agreement with this
scheme [60].
4.7.3 Molecular Taxonomy
Above the Species Level
Whilst only sequence data are suitable for the
construction of molecular phylogenetic trees, all
the other types of data mentioned above can be
used for species phylogenetic trees. As the reliability of the tree should increase with the information content of the data, species phylogenetic
trees are often constructed using the combined
data from several proteins. Such trees have, of
course, also been constructed for invertebrates,
especially for the more than 1000 species of the
genus Drosophila [28]. However, the vertebrates,
and especially humans, are particularly suitable
for demonstrating the possibilities and limitations
of molecular taxonomy.
Related to humans (hominoids) are the chimpanzee (Pan troglodytes), the dwarf chimpanzee
(P.paniscus), the gorilla (Gorilla gorilla), the
4 Molecular Evolution
Table 4.15. The average genetic distances, according to
Nei, between species of a genus and species of different
genera in the classes of vertebrates, weighted according to
the number of pair-wise comparisons [15]
Class
Osteichthyes
Amphibia
Reptilia
Aves
Mammalia
Genetic distance between
species
genera
0.60
0.76
1.75
0.67
0.08
0.24
0.41
1.10
which are not strongly correlated to the magnitude of molecular differences (p. 129).
The increase in evolutionary distance during
the course of species formation is also clearly
shown by restriction analysis of mtDNA: in North
American rodents, the sequence differences
between populations of the species Geomys pinetis amount to 0-4.7 %, between the sibling species Peromyscus polio notus and P. maniculatus to
15 %, and between the morphologically quite distinct species of the genus Peromyscus to consistently more than 20 % [225]. The mtDNA differences in local races of the house mouse, Mus
musculus, are at most 0.4 %, and between subspecies are up to 7.1 % [452]. The relationship
described above allows testing of the taxonomic
rank in critical cases. For example, in mussel taxonomy it was controversial whether two species
groups should be designated as the independent
genera of Musculium and Sphaerium; the D
values between the two groups of 1.10-2.11 are
much higher than those within the groups and
support the classification as genera [181]. In contrast, the butterflies Brenthis daphne and B. ino,
which exist in spatially separate populations on
different forage plants, have such a low genetic
distance, with D = 0.048, that doubts about their
status as species are quite justified [264].
With the aid of molecular data it is also possible to reconstruct, in some appropriate cases,
the evolutionary events in the history of individual species. Because of its purely maternal
inheritance the mtDNA provides hints about the
ancestors of parthenogenetic species, e.g. in the
fish genus Menidia or in the lizard genus Cnemidophorus [89, 103]. Restriction analysis of
mtDNA has also shown that the inbred line of
mice Mus musculus, now widely distributed
throughout many laboratories, is derived from a
single female. Fifteen different mtDNA types
were found in 20 examples of this species captured in the wild; in contrast, BALB/c, C57BLl6
and seven further established inbred lines all have
the same mtDNA, whereas new lines bred from
wild animals have variant mtDNAs. It is possible
that with time different wild males were crossedin so that the gene pool of the chromosomal DNA
could, nevertheless, be very extensive [118]. In
another example, comparative investigations of
the mtDNA of different races of the domestic pig
provide evidence for the introduction of various
European as well as Asiatic wild-pig females
[429]. The brown rat, Rattus norvegicus, is
derived from the house rat, R. rattus, which, however, occurs worldwide in several subspecies. The
highest similarity of mtDNA (an mtDNA difference of 2.3 % and the same chromosome number
of 2n = 44) is found between the brown rat and
the Asiatic house rat, R. rattus [laviceps, whereas
other subspecies of R. rattus show 8-9 % mtDNA
difference to the brown rat and have variant
chromosome numbers [161]. Molecular data can
also give information on the history of human
populations. Protein and DNA polymorphisms
show that the first phylogenetic branching was the
separation of African and non-African populations, and that the non-African populations then
split into two clusters, from one of which there
arose the Caucasian, East Asian, Arctic and
native American populations, and from the other
arose the populations of Southeast Asia, the
Pacific islands, New Guinea and Australasia. Linguistic data are in good agreement with this
scheme [60].
4.7.3 Molecular Taxonomy
Above the Species Level
Whilst only sequence data are suitable for the
construction of molecular phylogenetic trees, all
the other types of data mentioned above can be
used for species phylogenetic trees. As the reliability of the tree should increase with the information content of the data, species phylogenetic
trees are often constructed using the combined
data from several proteins. Such trees have, of
course, also been constructed for invertebrates,
especially for the more than 1000 species of the
genus Drosophila [28]. However, the vertebrates,
and especially humans, are particularly suitable
for demonstrating the possibilities and limitations
of molecular taxonomy.
Related to humans (hominoids) are the chimpanzee (Pan troglodytes), the dwarf chimpanzee
(P.paniscus), the gorilla (Gorilla gorilla), the