

European populations consist mostly of R. lessonae and R. esculenta, but both parental species
never occur together. The hybrid species known
as R. esculenta shows increased vigour compared
with the parental species, e.g. it has a greater
resistance to oxygen shortage at lower temperatures. Selfing R. esculenta results in progeny with
defective meiosis, reduced fertility and increased
lethality; in contrast, crosses of R. esculenta x
R.lessonae give normal R. esculenta. Furthermore, electrophoretic investigations of oocytes
show that most of the lessonae genome is eliminated during gametogenesis in R. esculenta and
only the ridibunda genome is passed on to the
progeny. The same is true for the populations of
the green frog in southern France and Italy; however, the mechanism by which the non-ridibunda
genome is eliminated has not been fully explained. Only about 7 % of hybrids are found in
the Balkan populations and these are apparently
hardly fertile; in this case the mechanisms of species hybridization appear to be not so far
advanced [392]. The analysis of mtDNA provides
more detailed information about the pairing
behaviour of green frog populations. As a rule, a
male pairs with a larger female; the average body
size increases in the order R. lessonae < R. esculenta < R. ridibunda. Pairing of an R.lessonae
male with an R. esculenta female results in an
R. esculenta individual with ridibunda mtDNA;
the rarer pairing of a large R. lessonae female
with a small R. esculenta male produces R. esculenta with lessonae mtDNA. There are two types
of mtDNA in R. ridibunda: the A form shows 8 %
difference to lessonae mtDNA and is apparently
typical for ridibunda; the B form is only 0.3 %
different to lessonae mtDNA and probably found
its way into the R. ridibunda population via occa4.7.2 Species Systematics
167
sional crosses between R. esculenta females and
R. ridibunda males [392].
Molecular data also provide answers to the
interesting question of the extent of the genetic
changes that occur during species formation
(speciation). In this respect, electrophoretic
methods have in particular been used to determine the genetic distance between taxa of different rank that represent successive stages in speciation. Especially instructive data are available for
flies of the American Drosophila willistoni group
and for mice from the genus Peromyscus (Table 4.14). The rule derived here, that the distance
increases with increasing taxonomic rank, has
since been confirmed by numerous investigations,
especially with all classes of vertebrates [15, 16];
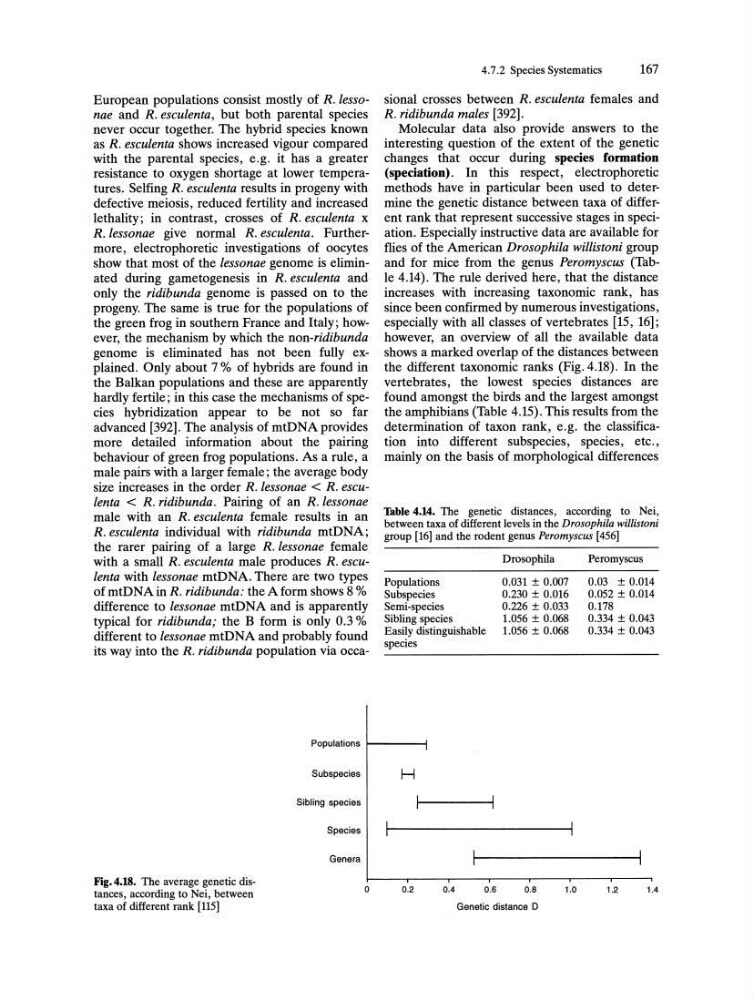
however, an overview of all the available data
shows a marked overlap of the distances between
the different taxonomic ranks (Fig. 4.18). In the
vertebrates, the lowest species distances are
found amongst the birds and the largest amongst
the amphibians (Table 4.15). This results from the
determination of taxon rank, e.g. the classification into different subspecies, species, etc.,
mainly on the basis of morphological differences
Table 4.14. The genetic distances, according to Nei,
between taxa of different levels in the Drosophila willistoni
group [16] and the rodent genus Peromyscus [456]
Populations
Subspecies
Semi-species
Sibling species
Easily distinguishable
species
Drosophila
0.031 ± 0.007
0.230 ± 0.016
0.226 ± 0.033
1.056 ± 0.068
1.056 ± 0.068
Peromyscus
0.03 ± 0.014
0.052 ± 0.014
0.178
0.334 ± 0.043
0.334 ± 0.043
Populations ~----I
Fig.4.18. The average genetic distances, according to Nei, between
taxa of different rank [115]
Subspecies
H
Sibling species
Species
Genera
o
0.2
0.4
0.6
0.8
1.0
1.2
1.4
Genetic distance D
never occur together. The hybrid species known
as R. esculenta shows increased vigour compared
with the parental species, e.g. it has a greater
resistance to oxygen shortage at lower temperatures. Selfing R. esculenta results in progeny with
defective meiosis, reduced fertility and increased
lethality; in contrast, crosses of R. esculenta x
R.lessonae give normal R. esculenta. Furthermore, electrophoretic investigations of oocytes
show that most of the lessonae genome is eliminated during gametogenesis in R. esculenta and
only the ridibunda genome is passed on to the
progeny. The same is true for the populations of
the green frog in southern France and Italy; however, the mechanism by which the non-ridibunda
genome is eliminated has not been fully explained. Only about 7 % of hybrids are found in
the Balkan populations and these are apparently
hardly fertile; in this case the mechanisms of species hybridization appear to be not so far
advanced [392]. The analysis of mtDNA provides
more detailed information about the pairing
behaviour of green frog populations. As a rule, a
male pairs with a larger female; the average body
size increases in the order R. lessonae < R. esculenta < R. ridibunda. Pairing of an R.lessonae
male with an R. esculenta female results in an
R. esculenta individual with ridibunda mtDNA;
the rarer pairing of a large R. lessonae female
with a small R. esculenta male produces R. esculenta with lessonae mtDNA. There are two types
of mtDNA in R. ridibunda: the A form shows 8 %
difference to lessonae mtDNA and is apparently
typical for ridibunda; the B form is only 0.3 %
different to lessonae mtDNA and probably found
its way into the R. ridibunda population via occa4.7.2 Species Systematics
167
sional crosses between R. esculenta females and
R. ridibunda males [392].
Molecular data also provide answers to the
interesting question of the extent of the genetic
changes that occur during species formation
(speciation). In this respect, electrophoretic
methods have in particular been used to determine the genetic distance between taxa of different rank that represent successive stages in speciation. Especially instructive data are available for
flies of the American Drosophila willistoni group
and for mice from the genus Peromyscus (Table 4.14). The rule derived here, that the distance
increases with increasing taxonomic rank, has
since been confirmed by numerous investigations,
especially with all classes of vertebrates [15, 16];
however, an overview of all the available data
shows a marked overlap of the distances between
the different taxonomic ranks (Fig. 4.18). In the
vertebrates, the lowest species distances are
found amongst the birds and the largest amongst
the amphibians (Table 4.15). This results from the
determination of taxon rank, e.g. the classification into different subspecies, species, etc.,
mainly on the basis of morphological differences
Table 4.14. The genetic distances, according to Nei,
between taxa of different levels in the Drosophila willistoni
group [16] and the rodent genus Peromyscus [456]
Populations
Subspecies
Semi-species
Sibling species
Easily distinguishable
species
Drosophila
0.031 ± 0.007
0.230 ± 0.016
0.226 ± 0.033
1.056 ± 0.068
1.056 ± 0.068
Peromyscus
0.03 ± 0.014
0.052 ± 0.014
0.178
0.334 ± 0.043
0.334 ± 0.043
Populations ~----I
Fig.4.18. The average genetic distances, according to Nei, between
taxa of different rank [115]
Subspecies
H
Sibling species
Species
Genera
o
0.2
0.4
0.6
0.8
1.0
1.2
1.4
Genetic distance D