

162
4 Molecular Evolution
4.6.2 The Rate of Evolution
of the Nucleic Acids
The rate of nucleic acid evolution is normally
given as the mean number of substitutions per
nucleotide per year; for coding sequences, a distinction is often made between the rates of amino
acid-exchanging and of synonymous substitutions. According to the neutral theory of evolution, there is a relationship between the fixation
rate and the selective value of mutations, and this
can be described mathematically [Eq. (4.8),
p. 141]. Thus; the substitution rate increases with
the proportion Pn of mutations which behave as
selectively neutral. When all mutations have no
influence on fitness (Pn = 1), the rate of evolution
reaches a maximum which is equal to the mutation rate. The rate of amino acid-exchanging substitutions differs between different genes by more
than two orders of magnitude, as has already
been shown by comparison of the proteins. The
rate of synonymous substitution is approximately
the same for all genes and is always significantly
higher than that of amino acid-exchanging substitution; most recorded values are around 5 . 10- 9
per nucleotide per year, with extremes of
1.3 . 10- 9 and 7.4 . 10- 9 • The variability in the rate
of synonymous substitution is at least partly due
to codon preference; the more the use of the various synonymous codons deviates from random,
the lower is the substitution rate [38, 210,
212,277]. If the rate remains constant, the number of synonymous substitutions that can be
detected on comparing two sequences will
eventually reach a saturation value; for the actin
genes this occurred after 30-40 million years.
Synonymous substitutions may be used only for
estimations of phylogenetic relationships and the
evolution rate before the point of saturation [4].
The frequency of mutation is actually quite
similar in all parts of the genome, but the probability of fixation of a mutation depends upon its
consequences; thus, the changes (substitutions)
that become fixed during evolution are not stochastically distributed throughout the genome. In
coding sequences, there are large differences in
substitution rate between the three codon positions. For example, the distribution of substitutions between the three positions in the globin
genes of man, the mouse and the rabbit is
24:21:55, showing a higher proportion of synonymous mutations in the third position
[210, 212]. In the non-coding sequences of genes
there are also characteristic differences in substitution rate in different regions which are
related to function; similar tendencies are found
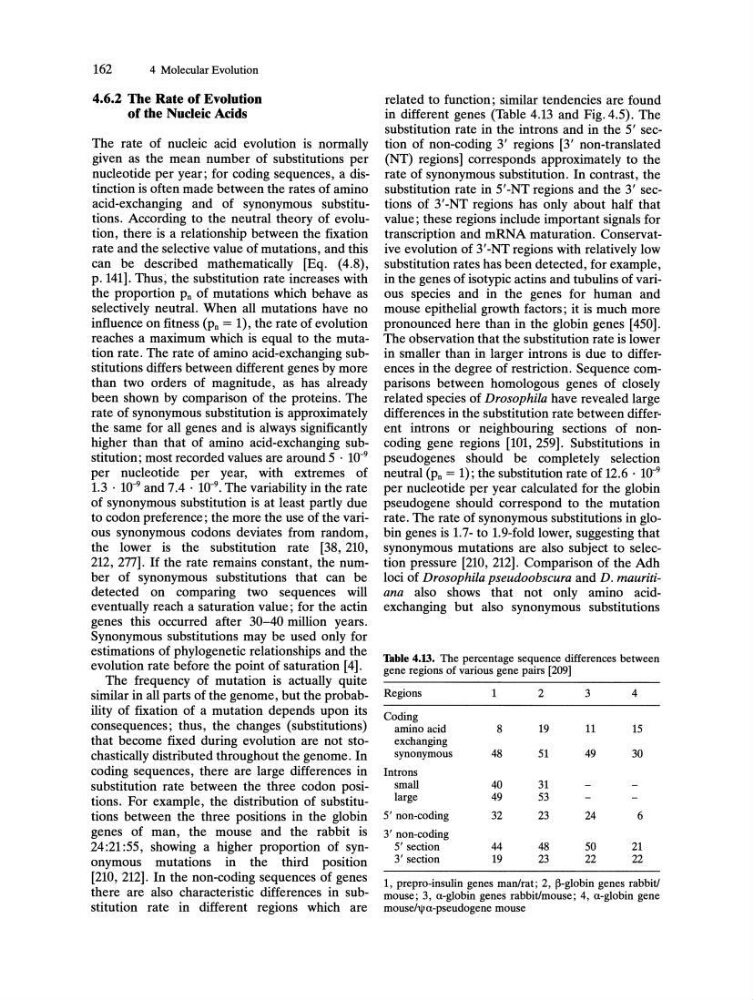
in different genes (Table 4.13 and Fig. 4.5). The
substitution rate in the introns and in the 5' section of non-coding 3' regions [3' non-translated
(NT) regions] corresponds approximately to the
rate of synonymous substitution. In contrast, the
substitution rate in 5'-NT regions and the 3' sections of 3'-NT regions has only about half that
value; these regions include important signals for
transcription and mRNA maturation. Conservative evolution of 3' -NT regions with relatively low
substitution rates has been detected, for example,
in the genes of isotypic actins and tubulins of various species and in the genes for human and
mouse epithelial growth factors; it is much more
pronounced here than in the globin genes [450].
The observation that the substitution rate is lower
in smaller than in larger introns is due to differences in the degree of restriction. Sequence comparisons between homologous genes of closely
related species of Drosophila have revealed large
differences in the substitution rate between different introns or neighbouring sections of noncoding gene regions [101, 259]. Substitutions in
pseudo genes should be completely selection
neutral (Pn = 1); the substitution rate of 12.6 . 10- 9
per nucleotide per year calculated for the globin
pseudo gene should correspond to the mutation
rate. The rate of synonymous substitutions in globin genes is 1.7- to 1.9-fold lower, suggesting that
synonymous mutations are also subject to selection pressure [210, 212]. Comparison of the Adh
loci of Drosophila pseudoobscura and D. mauritiana also shows that not only amino acidexchanging but also synonymous substitutions
Thble 4.13. The percentage sequence differences between
gene regions of various gene pairs [209]
Regions
1
2
3
4
Coding
amino acid
8
19
11
15
exchanging
synonymous
48
51
49
30
Introns
small
40
31
large
49
53
5' non-coding
32
23
24
6
3' non-coding
5' section
44
48
50
21
3' section
19
23
22
22
1, prepro-insulin genes man/rat; 2, ~-globin genes rabbit!
mouse; 3, a-globin genes rabbit!mouse; 4, a-globin gene
mousehpa-pseudogene mouse
4 Molecular Evolution
4.6.2 The Rate of Evolution
of the Nucleic Acids
The rate of nucleic acid evolution is normally
given as the mean number of substitutions per
nucleotide per year; for coding sequences, a distinction is often made between the rates of amino
acid-exchanging and of synonymous substitutions. According to the neutral theory of evolution, there is a relationship between the fixation
rate and the selective value of mutations, and this
can be described mathematically [Eq. (4.8),
p. 141]. Thus; the substitution rate increases with
the proportion Pn of mutations which behave as
selectively neutral. When all mutations have no
influence on fitness (Pn = 1), the rate of evolution
reaches a maximum which is equal to the mutation rate. The rate of amino acid-exchanging substitutions differs between different genes by more
than two orders of magnitude, as has already
been shown by comparison of the proteins. The
rate of synonymous substitution is approximately
the same for all genes and is always significantly
higher than that of amino acid-exchanging substitution; most recorded values are around 5 . 10- 9
per nucleotide per year, with extremes of
1.3 . 10- 9 and 7.4 . 10- 9 • The variability in the rate
of synonymous substitution is at least partly due
to codon preference; the more the use of the various synonymous codons deviates from random,
the lower is the substitution rate [38, 210,
212,277]. If the rate remains constant, the number of synonymous substitutions that can be
detected on comparing two sequences will
eventually reach a saturation value; for the actin
genes this occurred after 30-40 million years.
Synonymous substitutions may be used only for
estimations of phylogenetic relationships and the
evolution rate before the point of saturation [4].
The frequency of mutation is actually quite
similar in all parts of the genome, but the probability of fixation of a mutation depends upon its
consequences; thus, the changes (substitutions)
that become fixed during evolution are not stochastically distributed throughout the genome. In
coding sequences, there are large differences in
substitution rate between the three codon positions. For example, the distribution of substitutions between the three positions in the globin
genes of man, the mouse and the rabbit is
24:21:55, showing a higher proportion of synonymous mutations in the third position
[210, 212]. In the non-coding sequences of genes
there are also characteristic differences in substitution rate in different regions which are
related to function; similar tendencies are found
in different genes (Table 4.13 and Fig. 4.5). The
substitution rate in the introns and in the 5' section of non-coding 3' regions [3' non-translated
(NT) regions] corresponds approximately to the
rate of synonymous substitution. In contrast, the
substitution rate in 5'-NT regions and the 3' sections of 3'-NT regions has only about half that
value; these regions include important signals for
transcription and mRNA maturation. Conservative evolution of 3' -NT regions with relatively low
substitution rates has been detected, for example,
in the genes of isotypic actins and tubulins of various species and in the genes for human and
mouse epithelial growth factors; it is much more
pronounced here than in the globin genes [450].
The observation that the substitution rate is lower
in smaller than in larger introns is due to differences in the degree of restriction. Sequence comparisons between homologous genes of closely
related species of Drosophila have revealed large
differences in the substitution rate between different introns or neighbouring sections of noncoding gene regions [101, 259]. Substitutions in
pseudo genes should be completely selection
neutral (Pn = 1); the substitution rate of 12.6 . 10- 9
per nucleotide per year calculated for the globin
pseudo gene should correspond to the mutation
rate. The rate of synonymous substitutions in globin genes is 1.7- to 1.9-fold lower, suggesting that
synonymous mutations are also subject to selection pressure [210, 212]. Comparison of the Adh
loci of Drosophila pseudoobscura and D. mauritiana also shows that not only amino acidexchanging but also synonymous substitutions
Thble 4.13. The percentage sequence differences between
gene regions of various gene pairs [209]
Regions
1
2
3
4
Coding
amino acid
8
19
11
15
exchanging
synonymous
48
51
49
30
Introns
small
40
31
large
49
53
5' non-coding
32
23
24
6
3' non-coding
5' section
44
48
50
21
3' section
19
23
22
22
1, prepro-insulin genes man/rat; 2, ~-globin genes rabbit!
mouse; 3, a-globin genes rabbit!mouse; 4, a-globin gene
mousehpa-pseudogene mouse