

Pisaster ochraceus and compared with the reassociated DNA from one individual, showed a
reduction in Tm of 4 and 5.3 °C, respectively; this
corresponds to a sequence difference of 4-5 %
between the individuals [151, 384]. Differences in
the restriction endonuclease cleavage fragment
pattern also suggest sequence differences. Such a
restriction analysis can be carried out on isolated
fragments of chromosomal DNA; mtDNA,
which has exactly the right size of 15-19 kb and is
easily obtainable in useful amount, is especially
suitable for population genetics studies. A particular advantage of mtDNA is that it is purely
maternally inherited and, therefore, does not
undergo recombination. If, as in many species,
the males are more mobile than the females, then
the genetic flux in the population is dependent
largely on the migrations of males; the populations are then much more clearly structured with
regard to the mtDNA than the alleloproteins.
Various mathematical and statistical processes
have been suggested for evaluating restriction
analysis data [108, 182,290]. However, a relationship between the polymorphism of a cleavage site
and the total DNA sequence cannot be unambiguously defined because, for example, longer
insertions or deletions and the rearrangement of
sequences, as are frequently found in non-coding
DNA regions, cannot be detected. According to
Ewens [108], the mean heterozygosity per nucleotide can be calculated as follows. In n DNA
sequences there may be m cleavage sites of which
k are polymorphic. Given the employment of several enzymes with recognition sequences of four
or six nucleotides, the mean heterozygosity per
nucleotide is
8 = (k4 + k6/ [(8m4 + 12m6)logen] (4.5)
Nei [290] defined a nucleon diversity analogous
to the heterozygosity [Eq. (4.2)].
hn = 1 - Lp 2 i
(4.6)
By nucleon is meant any defined DNA sequence
for which i different cleavage patterns (nucleomorphs) are possible, each in the proportion Pi;
this equation should take into account insertions
and deletions.
Restriction analysis has produced evidence for
polymorphism of mtDNA in man and various
mammals, birds and reptiles (Table 4.11), as well
as the invertebrates Drosophila and the crustacean Panulirus argus [270] (Table 4.11). The nucleotide substitutions in man, for example, are
evenly distributed over the whole mtDNA, so
that between 2 and over 40 allelic variants were
4.3.7 DNA Polymorphism
139
detected for each of the 28 examined loci (13 proteins, 10 tRNAs, 2 rRNAs and 3 non-coding regions) in 145 individuals [434]. As well as differences in mtDNA sequences, there are also differences in mtDNA size; the relative degree of these
two forms of mtDNA polymorphism differ
greatly between species. No fewer than 37 size
variants of mtDNA were found amongst 92 individuals of the lizard Cnemidophorus tess altus ,
whereas the sequence difference of 0.06 % was
extremely small [158]. In contrast, the mtDNA of
rats and other rodents, shows considerable
sequence variability but very little size difference
[162]. In the insects Drosophila melanogaster and
Gryllus firmus, heteroplasmy is often observed,
i.e. the existence in the same individual of two
mtDNA variants [158,341]. If there is evidence
of length polymorphism in the mtDNA, then not
only the number but also the length of the cleavage fragments must be taken into account during
restriction analysis [41, 162, 226].
Intraspecific comparisons of chromosomal
DNA sequences by use of restriction analysis
have been less often reported. It should also be
noted here that the observed polymorphism can
be due just as well to rearrangements of the DNA
as to nucleotide substitutions. Seventeen different restriction patterns of the human B-globin
locus are frequently observed, of which 14 are distributed worldwide and 3 are limited to certain
populations. The sequence differences responsible are located predominantly in the non-coding
flanking sequences and the introns [309]. In
D. melanogaster, restriction analysis has been
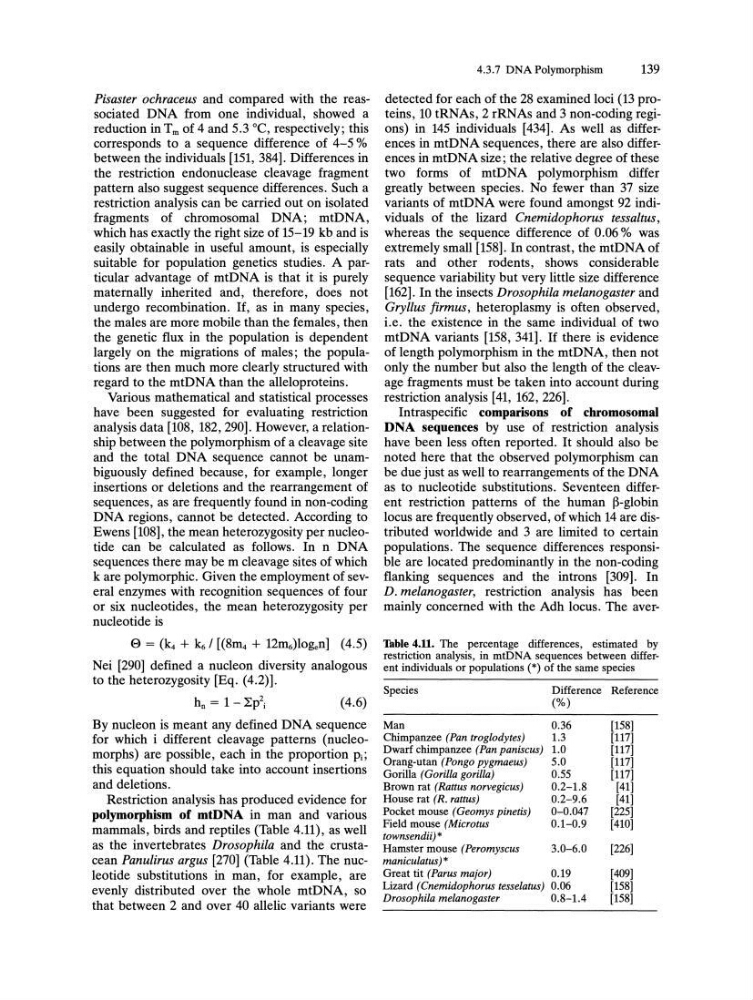
mainly concerned with the Adh locus. The averTable 4.11. The percentage differences, estimated by
restriction analysis, in mtDNA sequences between different individuals or populations (*) of the same species
Species
Difference Reference
(%)
Man
0.36
[158]
Chimpanzee (Pan troglodytes)
1.3
[117]
Dwarf chimpanzee (Pan paniscus) 1.0
[117]
Orangoutan (Pongo pygmaeus)
5.0
[117]
Gorilla (Gorilla gorilla)
0.55
[117]
Brown rat (Rattus norvegicus)
0.2-1.8
[41]
House rat (R. rattus)
0.2-9.6
[41]
Pocket mouse (Geomys pinetis)
0-0.047
[225]
Field mouse (Microtus
0.1-0.9
[410]
townsendii) *
Hamster mouse (Peromyscus
3.0-6.0
[226]
maniculatus) *
Great tit (Parus major)
0.19
[409]
Lizard (Cnemidophorus tesselatus) 0.06
[158]
Drosophila melanogaster
0.8-1.4
[158]
reduction in Tm of 4 and 5.3 °C, respectively; this
corresponds to a sequence difference of 4-5 %
between the individuals [151, 384]. Differences in
the restriction endonuclease cleavage fragment
pattern also suggest sequence differences. Such a
restriction analysis can be carried out on isolated
fragments of chromosomal DNA; mtDNA,
which has exactly the right size of 15-19 kb and is
easily obtainable in useful amount, is especially
suitable for population genetics studies. A particular advantage of mtDNA is that it is purely
maternally inherited and, therefore, does not
undergo recombination. If, as in many species,
the males are more mobile than the females, then
the genetic flux in the population is dependent
largely on the migrations of males; the populations are then much more clearly structured with
regard to the mtDNA than the alleloproteins.
Various mathematical and statistical processes
have been suggested for evaluating restriction
analysis data [108, 182,290]. However, a relationship between the polymorphism of a cleavage site
and the total DNA sequence cannot be unambiguously defined because, for example, longer
insertions or deletions and the rearrangement of
sequences, as are frequently found in non-coding
DNA regions, cannot be detected. According to
Ewens [108], the mean heterozygosity per nucleotide can be calculated as follows. In n DNA
sequences there may be m cleavage sites of which
k are polymorphic. Given the employment of several enzymes with recognition sequences of four
or six nucleotides, the mean heterozygosity per
nucleotide is
8 = (k4 + k6/ [(8m4 + 12m6)logen] (4.5)
Nei [290] defined a nucleon diversity analogous
to the heterozygosity [Eq. (4.2)].
hn = 1 - Lp 2 i
(4.6)
By nucleon is meant any defined DNA sequence
for which i different cleavage patterns (nucleomorphs) are possible, each in the proportion Pi;
this equation should take into account insertions
and deletions.
Restriction analysis has produced evidence for
polymorphism of mtDNA in man and various
mammals, birds and reptiles (Table 4.11), as well
as the invertebrates Drosophila and the crustacean Panulirus argus [270] (Table 4.11). The nucleotide substitutions in man, for example, are
evenly distributed over the whole mtDNA, so
that between 2 and over 40 allelic variants were
4.3.7 DNA Polymorphism
139
detected for each of the 28 examined loci (13 proteins, 10 tRNAs, 2 rRNAs and 3 non-coding regions) in 145 individuals [434]. As well as differences in mtDNA sequences, there are also differences in mtDNA size; the relative degree of these
two forms of mtDNA polymorphism differ
greatly between species. No fewer than 37 size
variants of mtDNA were found amongst 92 individuals of the lizard Cnemidophorus tess altus ,
whereas the sequence difference of 0.06 % was
extremely small [158]. In contrast, the mtDNA of
rats and other rodents, shows considerable
sequence variability but very little size difference
[162]. In the insects Drosophila melanogaster and
Gryllus firmus, heteroplasmy is often observed,
i.e. the existence in the same individual of two
mtDNA variants [158,341]. If there is evidence
of length polymorphism in the mtDNA, then not
only the number but also the length of the cleavage fragments must be taken into account during
restriction analysis [41, 162, 226].
Intraspecific comparisons of chromosomal
DNA sequences by use of restriction analysis
have been less often reported. It should also be
noted here that the observed polymorphism can
be due just as well to rearrangements of the DNA
as to nucleotide substitutions. Seventeen different restriction patterns of the human B-globin
locus are frequently observed, of which 14 are distributed worldwide and 3 are limited to certain
populations. The sequence differences responsible are located predominantly in the non-coding
flanking sequences and the introns [309]. In
D. melanogaster, restriction analysis has been
mainly concerned with the Adh locus. The averTable 4.11. The percentage differences, estimated by
restriction analysis, in mtDNA sequences between different individuals or populations (*) of the same species
Species
Difference Reference
(%)
Man
0.36
[158]
Chimpanzee (Pan troglodytes)
1.3
[117]
Dwarf chimpanzee (Pan paniscus) 1.0
[117]
Orangoutan (Pongo pygmaeus)
5.0
[117]
Gorilla (Gorilla gorilla)
0.55
[117]
Brown rat (Rattus norvegicus)
0.2-1.8
[41]
House rat (R. rattus)
0.2-9.6
[41]
Pocket mouse (Geomys pinetis)
0-0.047
[225]
Field mouse (Microtus
0.1-0.9
[410]
townsendii) *
Hamster mouse (Peromyscus
3.0-6.0
[226]
maniculatus) *
Great tit (Parus major)
0.19
[409]
Lizard (Cnemidophorus tesselatus) 0.06
[158]
Drosophila melanogaster
0.8-1.4
[158]