

18 The Seascape as an Indicator of Environmental Interest and Quality . . .
279
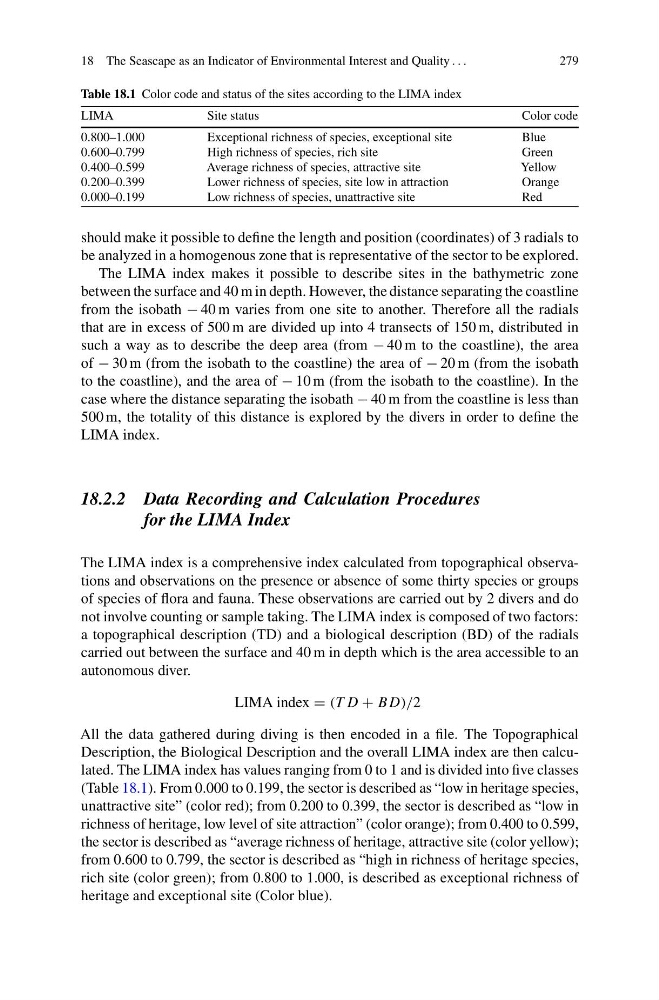
Table 18.1 Color code and status of the sites according to the LIMA index
LIMA
Site status
Color code
0.800–1.000
Exceptional richness of species, exceptional site
Blue
0.600–0.799
High richness of species, rich site
Green
0.400–0.599
Average richness of species, attractive site
Yellow
0.200–0.399
Lower richness of species, site low in attraction
Orange
0.000–0.199
Low richness of species, unattractive site
Red
should make it possible to define the length and position (coordinates) of 3 radials to
be analyzed in a homogenous zone that is representative of the sector to be explored.
The LIMA index makes it possible to describe sites in the bathymetric zone
between the surface and 40 m in depth. However, the distance separating the coastline
from the isobath − 40 m varies from one site to another. Therefore all the radials
that are in excess of 500 m are divided up into 4 transects of 150 m, distributed in
such a way as to describe the deep area (from − 40 m to the coastline), the area
of − 30 m (from the isobath to the coastline) the area of − 20 m (from the isobath
to the coastline), and the area of − 10 m (from the isobath to the coastline). In the
case where the distance separating the isobath − 40 m from the coastline is less than
500 m, the totality of this distance is explored by the divers in order to define the
LIMA index.
18.2.2 Data Recording and Calculation Procedures
for the LIMA Index
The LIMA index is a comprehensive index calculated from topographical observations and observations on the presence or absence of some thirty species or groups
of species of flora and fauna. These observations are carried out by 2 divers and do
not involve counting or sample taking. The LIMA index is composed of two factors:
a topographical description (TD) and a biological description (BD) of the radials
carried out between the surface and 40 m in depth which is the area accessible to an
autonomous diver.
LIMA index = (T D + BD)/2
All the data gathered during diving is then encoded in a file. The Topographical
Description, the Biological Description and the overall LIMA index are then calculated. The LIMA index has values ranging from 0 to 1 and is divided into five classes
(Table 18.1). From 0.000 to 0.199, the sector is described as “low in heritage species,
unattractive site” (color red); from 0.200 to 0.399, the sector is described as “low in
richness of heritage, low level of site attraction” (color orange); from 0.400 to 0.599,
the sector is described as “average richness of heritage, attractive site (color yellow);
from 0.600 to 0.799, the sector is described as “high in richness of heritage species,
rich site (color green); from 0.800 to 1.000, is described as exceptional richness of
heritage and exceptional site (Color blue).
279
Table 18.1 Color code and status of the sites according to the LIMA index
LIMA
Site status
Color code
0.800–1.000
Exceptional richness of species, exceptional site
Blue
0.600–0.799
High richness of species, rich site
Green
0.400–0.599
Average richness of species, attractive site
Yellow
0.200–0.399
Lower richness of species, site low in attraction
Orange
0.000–0.199
Low richness of species, unattractive site
Red
should make it possible to define the length and position (coordinates) of 3 radials to
be analyzed in a homogenous zone that is representative of the sector to be explored.
The LIMA index makes it possible to describe sites in the bathymetric zone
between the surface and 40 m in depth. However, the distance separating the coastline
from the isobath − 40 m varies from one site to another. Therefore all the radials
that are in excess of 500 m are divided up into 4 transects of 150 m, distributed in
such a way as to describe the deep area (from − 40 m to the coastline), the area
of − 30 m (from the isobath to the coastline) the area of − 20 m (from the isobath
to the coastline), and the area of − 10 m (from the isobath to the coastline). In the
case where the distance separating the isobath − 40 m from the coastline is less than
500 m, the totality of this distance is explored by the divers in order to define the
LIMA index.
18.2.2 Data Recording and Calculation Procedures
for the LIMA Index
The LIMA index is a comprehensive index calculated from topographical observations and observations on the presence or absence of some thirty species or groups
of species of flora and fauna. These observations are carried out by 2 divers and do
not involve counting or sample taking. The LIMA index is composed of two factors:
a topographical description (TD) and a biological description (BD) of the radials
carried out between the surface and 40 m in depth which is the area accessible to an
autonomous diver.
LIMA index = (T D + BD)/2
All the data gathered during diving is then encoded in a file. The Topographical
Description, the Biological Description and the overall LIMA index are then calculated. The LIMA index has values ranging from 0 to 1 and is divided into five classes
(Table 18.1). From 0.000 to 0.199, the sector is described as “low in heritage species,
unattractive site” (color red); from 0.200 to 0.399, the sector is described as “low in
richness of heritage, low level of site attraction” (color orange); from 0.400 to 0.599,
the sector is described as “average richness of heritage, attractive site (color yellow);
from 0.600 to 0.799, the sector is described as “high in richness of heritage species,
rich site (color green); from 0.800 to 1.000, is described as exceptional richness of
heritage and exceptional site (Color blue).