

268
S. Thorin et al.
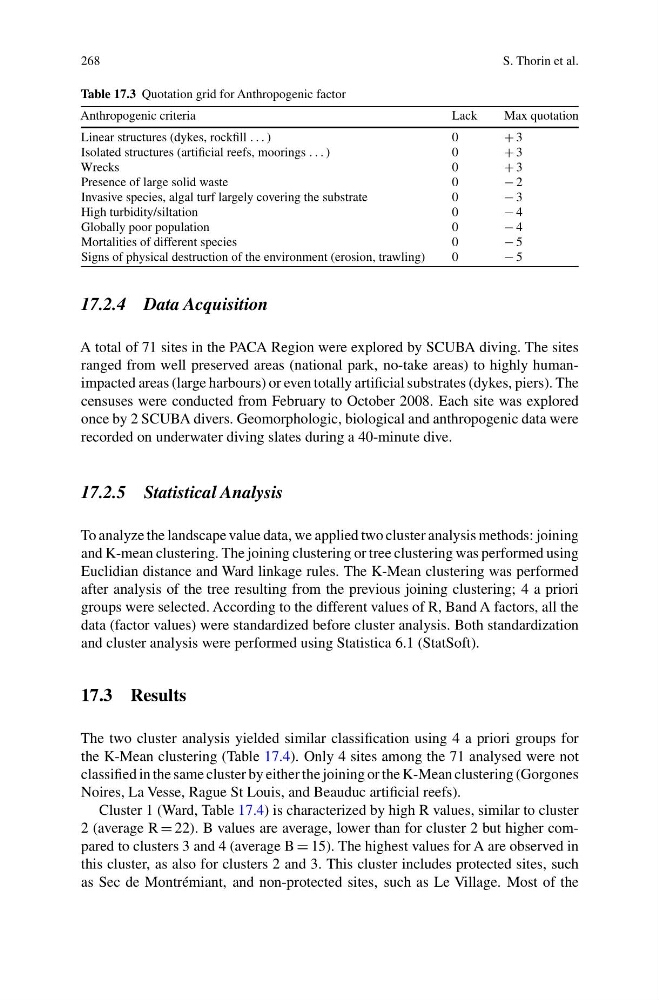
Table 17.3 Quotation grid for Anthropogenic factor
Anthropogenic criteria
Lack
Max quotation
Linear structures (dykes, rockfill . . . )
0
+ 3
Isolated structures (artificial reefs, moorings . . . )
0
+ 3
Wrecks
0
+ 3
Presence of large solid waste
0
− 2
Invasive species, algal turf largely covering the substrate
0
− 3
High turbidity/siltation
0
− 4
Globally poor population
0
− 4
Mortalities of different species
0
− 5
Signs of physical destruction of the environment (erosion, trawling)
0
− 5
17.2.4 Data Acquisition
A total of 71 sites in the PACA Region were explored by SCUBA diving. The sites
ranged from well preserved areas (national park, no-take areas) to highly humanimpacted areas (large harbours) or even totally artificial substrates (dykes, piers). The
censuses were conducted from February to October 2008. Each site was explored
once by 2 SCUBA divers. Geomorphologic, biological and anthropogenic data were
recorded on underwater diving slates during a 40-minute dive.
17.2.5 Statistical Analysis
To analyze the landscape value data, we applied two cluster analysis methods: joining
and K-mean clustering. The joining clustering or tree clustering was performed using
Euclidian distance and Ward linkage rules. The K-Mean clustering was performed
after analysis of the tree resulting from the previous joining clustering; 4 a priori
groups were selected. According to the different values of R, Band A factors, all the
data (factor values) were standardized before cluster analysis. Both standardization
and cluster analysis were performed using Statistica 6.1 (StatSoft).
17.3 Results
The two cluster analysis yielded similar classification using 4 a priori groups for
the K-Mean clustering (Table 17.4). Only 4 sites among the 71 analysed were not
classified in the same cluster by either the joining or the K-Mean clustering (Gorgones
Noires, La Vesse, Rague St Louis, and Beauduc artificial reefs).
Cluster 1 (Ward, Table 17.4) is characterized by high R values, similar to cluster
2 (average R = 22). B values are average, lower than for cluster 2 but higher compared to clusters 3 and 4 (average B = 15). The highest values for A are observed in
this cluster, as also for clusters 2 and 3. This cluster includes protected sites, such
as Sec de Montrémiant, and non-protected sites, such as Le Village. Most of the
S. Thorin et al.
Table 17.3 Quotation grid for Anthropogenic factor
Anthropogenic criteria
Lack
Max quotation
Linear structures (dykes, rockfill . . . )
0
+ 3
Isolated structures (artificial reefs, moorings . . . )
0
+ 3
Wrecks
0
+ 3
Presence of large solid waste
0
− 2
Invasive species, algal turf largely covering the substrate
0
− 3
High turbidity/siltation
0
− 4
Globally poor population
0
− 4
Mortalities of different species
0
− 5
Signs of physical destruction of the environment (erosion, trawling)
0
− 5
17.2.4 Data Acquisition
A total of 71 sites in the PACA Region were explored by SCUBA diving. The sites
ranged from well preserved areas (national park, no-take areas) to highly humanimpacted areas (large harbours) or even totally artificial substrates (dykes, piers). The
censuses were conducted from February to October 2008. Each site was explored
once by 2 SCUBA divers. Geomorphologic, biological and anthropogenic data were
recorded on underwater diving slates during a 40-minute dive.
17.2.5 Statistical Analysis
To analyze the landscape value data, we applied two cluster analysis methods: joining
and K-mean clustering. The joining clustering or tree clustering was performed using
Euclidian distance and Ward linkage rules. The K-Mean clustering was performed
after analysis of the tree resulting from the previous joining clustering; 4 a priori
groups were selected. According to the different values of R, Band A factors, all the
data (factor values) were standardized before cluster analysis. Both standardization
and cluster analysis were performed using Statistica 6.1 (StatSoft).
17.3 Results
The two cluster analysis yielded similar classification using 4 a priori groups for
the K-Mean clustering (Table 17.4). Only 4 sites among the 71 analysed were not
classified in the same cluster by either the joining or the K-Mean clustering (Gorgones
Noires, La Vesse, Rague St Louis, and Beauduc artificial reefs).
Cluster 1 (Ward, Table 17.4) is characterized by high R values, similar to cluster
2 (average R = 22). B values are average, lower than for cluster 2 but higher compared to clusters 3 and 4 (average B = 15). The highest values for A are observed in
this cluster, as also for clusters 2 and 3. This cluster includes protected sites, such
as Sec de Montrémiant, and non-protected sites, such as Le Village. Most of the