

156
A. Curd and A. Pibot
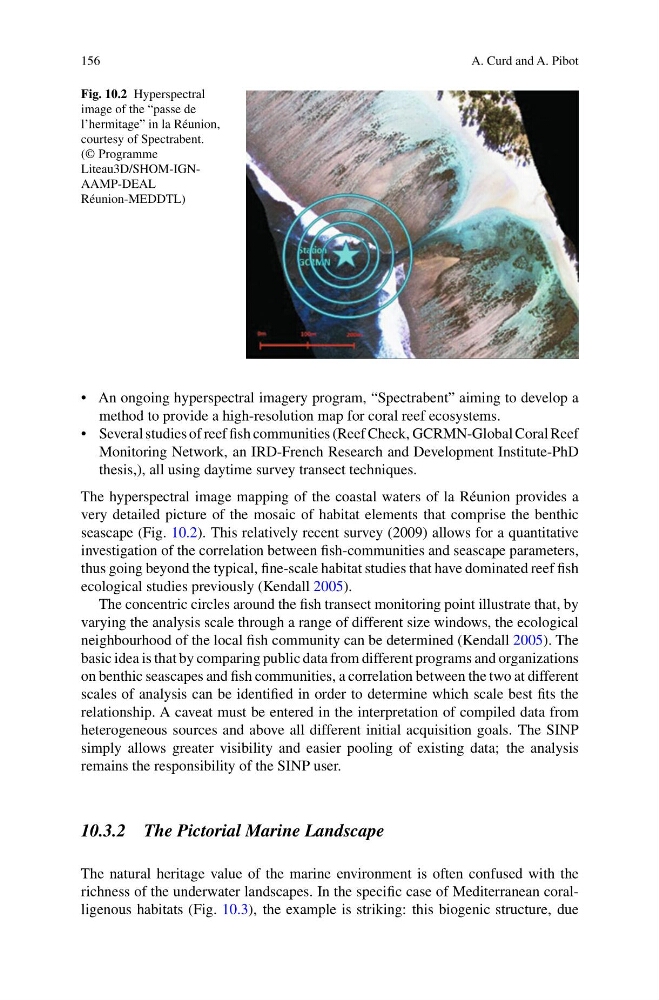
Fig. 10.2 Hyperspectral
image of the “passe de
l’hermitage” in la Réunion,
courtesy of Spectrabent.
(© Programme
Liteau3D/SHOM-IGNAAMP-DEAL
Réunion-MEDDTL)
• An ongoing hyperspectral imagery program, “Spectrabent” aiming to develop a
method to provide a high-resolution map for coral reef ecosystems.
• Several studies of reef fish communities (Reef Check, GCRMN-Global Coral Reef
Monitoring Network, an IRD-French Research and Development Institute-PhD
thesis,), all using daytime survey transect techniques.
The hyperspectral image mapping of the coastal waters of la Réunion provides a
very detailed picture of the mosaic of habitat elements that comprise the benthic
seascape (Fig. 10.2). This relatively recent survey (2009) allows for a quantitative
investigation of the correlation between fish-communities and seascape parameters,
thus going beyond the typical, fine-scale habitat studies that have dominated reef fish
ecological studies previously (Kendall 2005).
The concentric circles around the fish transect monitoring point illustrate that, by
varying the analysis scale through a range of different size windows, the ecological
neighbourhood of the local fish community can be determined (Kendall 2005). The
basic idea is that by comparing public data from different programs and organizations
on benthic seascapes and fish communities, a correlation between the two at different
scales of analysis can be identified in order to determine which scale best fits the
relationship. A caveat must be entered in the interpretation of compiled data from
heterogeneous sources and above all different initial acquisition goals. The SINP
simply allows greater visibility and easier pooling of existing data; the analysis
remains the responsibility of the SINP user.
10.3.2 The Pictorial Marine Landscape
The natural heritage value of the marine environment is often confused with the
richness of the underwater landscapes. In the specific case of Mediterranean coralligenous habitats (Fig. 10.3), the example is striking: this biogenic structure, due
A. Curd and A. Pibot
Fig. 10.2 Hyperspectral
image of the “passe de
l’hermitage” in la Réunion,
courtesy of Spectrabent.
(© Programme
Liteau3D/SHOM-IGNAAMP-DEAL
Réunion-MEDDTL)
• An ongoing hyperspectral imagery program, “Spectrabent” aiming to develop a
method to provide a high-resolution map for coral reef ecosystems.
• Several studies of reef fish communities (Reef Check, GCRMN-Global Coral Reef
Monitoring Network, an IRD-French Research and Development Institute-PhD
thesis,), all using daytime survey transect techniques.
The hyperspectral image mapping of the coastal waters of la Réunion provides a
very detailed picture of the mosaic of habitat elements that comprise the benthic
seascape (Fig. 10.2). This relatively recent survey (2009) allows for a quantitative
investigation of the correlation between fish-communities and seascape parameters,
thus going beyond the typical, fine-scale habitat studies that have dominated reef fish
ecological studies previously (Kendall 2005).
The concentric circles around the fish transect monitoring point illustrate that, by
varying the analysis scale through a range of different size windows, the ecological
neighbourhood of the local fish community can be determined (Kendall 2005). The
basic idea is that by comparing public data from different programs and organizations
on benthic seascapes and fish communities, a correlation between the two at different
scales of analysis can be identified in order to determine which scale best fits the
relationship. A caveat must be entered in the interpretation of compiled data from
heterogeneous sources and above all different initial acquisition goals. The SINP
simply allows greater visibility and easier pooling of existing data; the analysis
remains the responsibility of the SINP user.
10.3.2 The Pictorial Marine Landscape
The natural heritage value of the marine environment is often confused with the
richness of the underwater landscapes. In the specific case of Mediterranean coralligenous habitats (Fig. 10.3), the example is striking: this biogenic structure, due