

448
Michael A. Borowitzka, Paul Lavery, and Mike van Keulen
Table 1. Relationship between epiphyte biomass and the phenology of the seagrass.
Functional
Epiphyte biomass
Epiphyte biomass
% of aboveSpecies
group
(g m
−2 )
( g g
−1 )
ground biomass
Western Australia (Lavery, unpublished results)
Amphibolis griffithii
Persistent; Structurally
complex; Slow stem
turnover
50–450
0.56
36
Posidonia coriacea
Persistent; Structurally
simple; Slow leaf
turnover
1–45
0.16
14
Heterozostera
tasmanica
Short-lived; Structurally
simple; Rapid turnover
0.1–8
0.02
2.3
Florida, USA (Wear et al., 1999)
Thalassia testudinum
Persistent; Structurally
complex; Slow stem
turnover
40–125
0.44
31
Syringodium filiforme
Intermediate persistence
and turnover;
Structurally simple
60–100
0.58
37
Halodule wrightii
Short-lived; Structurally
simple; Fast turnover
20–110
0.78
44
(15–25 m) sites and also found compositional shifts
over depth. Shifts in composition of Z. marina and
Halodule wrightii epiphyte assemblages from diatom to cyanobacteria were attributed partially to
depth (Pinckney and Micheli, 1998) and effects of
depth were observed for more ephemeral seagrass
species (Heterozostera tasmanica, Zostera muelleri,
and Ruppia megacarpa) over a shallow depth range
(0–2 m). Epiphyte biomass at 0–0.5 and 0.5–1.0 m,
and on a m
−2 basis, was about 70% higher than at
1.0–1.9 m. When normalized to leaf biomass, the
trend is even more dramatic since seagrass biomass
was higher at depth. However, there did appear to be
a depth-by-site interaction in this study, suggesting
that effects of depth could be over-ridden by other
factors.
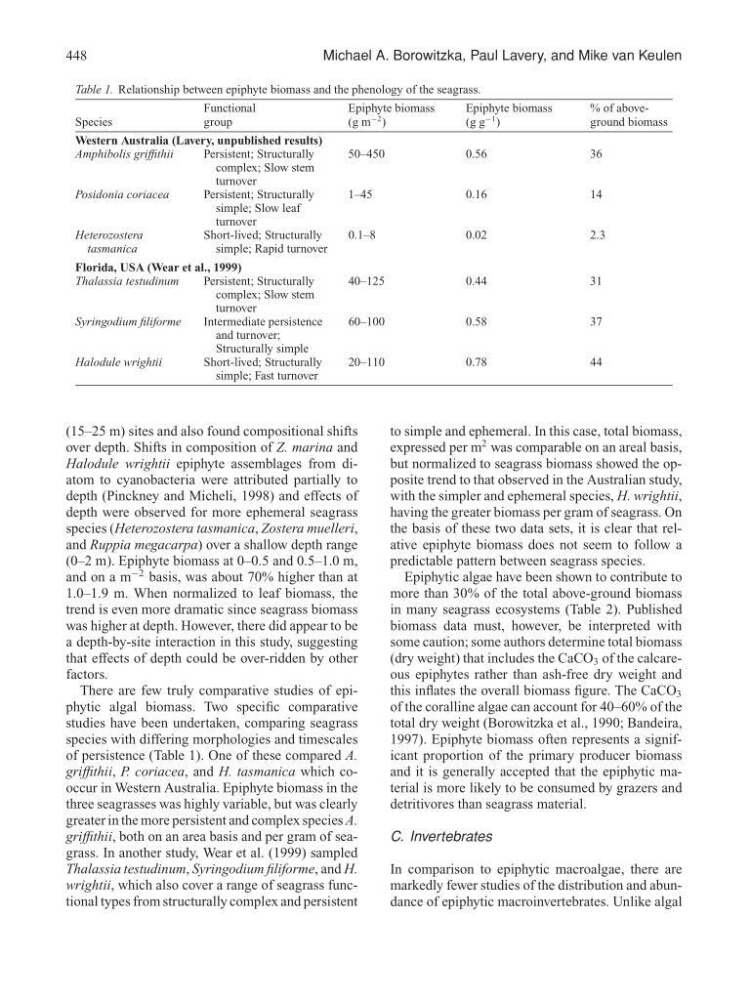
There are few truly comparative studies of epiphytic algal biomass. Two specific comparative
studies have been undertaken, comparing seagrass
species with differing morphologies and timescales
of persistence (Table 1). One of these compared A.
griffithii, P. coriacea, and H. tasmanica which cooccur in Western Australia. Epiphyte biomass in the
three seagrasses was highly variable, but was clearly
greater in the more persistent and complex species A.
griffithii, both on an area basis and per gram of seagrass. In another study, Wear et al. (1999) sampled
Thalassia testudinum, Syringodium filiforme, and H.
wrightii, which also cover a range of seagrass functional types from structurally complex and persistent
to simple and ephemeral. In this case, total biomass,
expressed per m
2 was comparable on an areal basis,
but normalized to seagrass biomass showed the opposite trend to that observed in the Australian study,
with the simpler and ephemeral species, H. wrightii,
having the greater biomass per gram of seagrass. On
the basis of these two data sets, it is clear that relative epiphyte biomass does not seem to follow a
predictable pattern between seagrass species.
Epiphytic algae have been shown to contribute to
more than 30% of the total above-ground biomass
in many seagrass ecosystems (Table 2). Published
biomass data must, however, be interpreted with
some caution; some authors determine total biomass
(dry weight) that includes the CaCO 3 of the calcareous epiphytes rather than ash-free dry weight and
this inflates the overall biomass figure. The CaCO 3
of the coralline algae can account for 40–60% of the
total dry weight (Borowitzka et al., 1990; Bandeira,
1997). Epiphyte biomass often represents a significant proportion of the primary producer biomass
and it is generally accepted that the epiphytic material is more likely to be consumed by grazers and
detritivores than seagrass material.
C. Invertebrates
In comparison to epiphytic macroalgae, there are
markedly fewer studies of the distribution and abundance of epiphytic macroinvertebrates. Unlike algal
Michael A. Borowitzka, Paul Lavery, and Mike van Keulen
Table 1. Relationship between epiphyte biomass and the phenology of the seagrass.
Functional
Epiphyte biomass
Epiphyte biomass
% of aboveSpecies
group
(g m
−2 )
( g g
−1 )
ground biomass
Western Australia (Lavery, unpublished results)
Amphibolis griffithii
Persistent; Structurally
complex; Slow stem
turnover
50–450
0.56
36
Posidonia coriacea
Persistent; Structurally
simple; Slow leaf
turnover
1–45
0.16
14
Heterozostera
tasmanica
Short-lived; Structurally
simple; Rapid turnover
0.1–8
0.02
2.3
Florida, USA (Wear et al., 1999)
Thalassia testudinum
Persistent; Structurally
complex; Slow stem
turnover
40–125
0.44
31
Syringodium filiforme
Intermediate persistence
and turnover;
Structurally simple
60–100
0.58
37
Halodule wrightii
Short-lived; Structurally
simple; Fast turnover
20–110
0.78
44
(15–25 m) sites and also found compositional shifts
over depth. Shifts in composition of Z. marina and
Halodule wrightii epiphyte assemblages from diatom to cyanobacteria were attributed partially to
depth (Pinckney and Micheli, 1998) and effects of
depth were observed for more ephemeral seagrass
species (Heterozostera tasmanica, Zostera muelleri,
and Ruppia megacarpa) over a shallow depth range
(0–2 m). Epiphyte biomass at 0–0.5 and 0.5–1.0 m,
and on a m
−2 basis, was about 70% higher than at
1.0–1.9 m. When normalized to leaf biomass, the
trend is even more dramatic since seagrass biomass
was higher at depth. However, there did appear to be
a depth-by-site interaction in this study, suggesting
that effects of depth could be over-ridden by other
factors.
There are few truly comparative studies of epiphytic algal biomass. Two specific comparative
studies have been undertaken, comparing seagrass
species with differing morphologies and timescales
of persistence (Table 1). One of these compared A.
griffithii, P. coriacea, and H. tasmanica which cooccur in Western Australia. Epiphyte biomass in the
three seagrasses was highly variable, but was clearly
greater in the more persistent and complex species A.
griffithii, both on an area basis and per gram of seagrass. In another study, Wear et al. (1999) sampled
Thalassia testudinum, Syringodium filiforme, and H.
wrightii, which also cover a range of seagrass functional types from structurally complex and persistent
to simple and ephemeral. In this case, total biomass,
expressed per m
2 was comparable on an areal basis,
but normalized to seagrass biomass showed the opposite trend to that observed in the Australian study,
with the simpler and ephemeral species, H. wrightii,
having the greater biomass per gram of seagrass. On
the basis of these two data sets, it is clear that relative epiphyte biomass does not seem to follow a
predictable pattern between seagrass species.
Epiphytic algae have been shown to contribute to
more than 30% of the total above-ground biomass
in many seagrass ecosystems (Table 2). Published
biomass data must, however, be interpreted with
some caution; some authors determine total biomass
(dry weight) that includes the CaCO 3 of the calcareous epiphytes rather than ash-free dry weight and
this inflates the overall biomass figure. The CaCO 3
of the coralline algae can account for 40–60% of the
total dry weight (Borowitzka et al., 1990; Bandeira,
1997). Epiphyte biomass often represents a significant proportion of the primary producer biomass
and it is generally accepted that the epiphytic material is more likely to be consumed by grazers and
detritivores than seagrass material.
C. Invertebrates
In comparison to epiphytic macroalgae, there are
markedly fewer studies of the distribution and abundance of epiphytic macroinvertebrates. Unlike algal