

Chapter 17 Biology of Posidonia
393
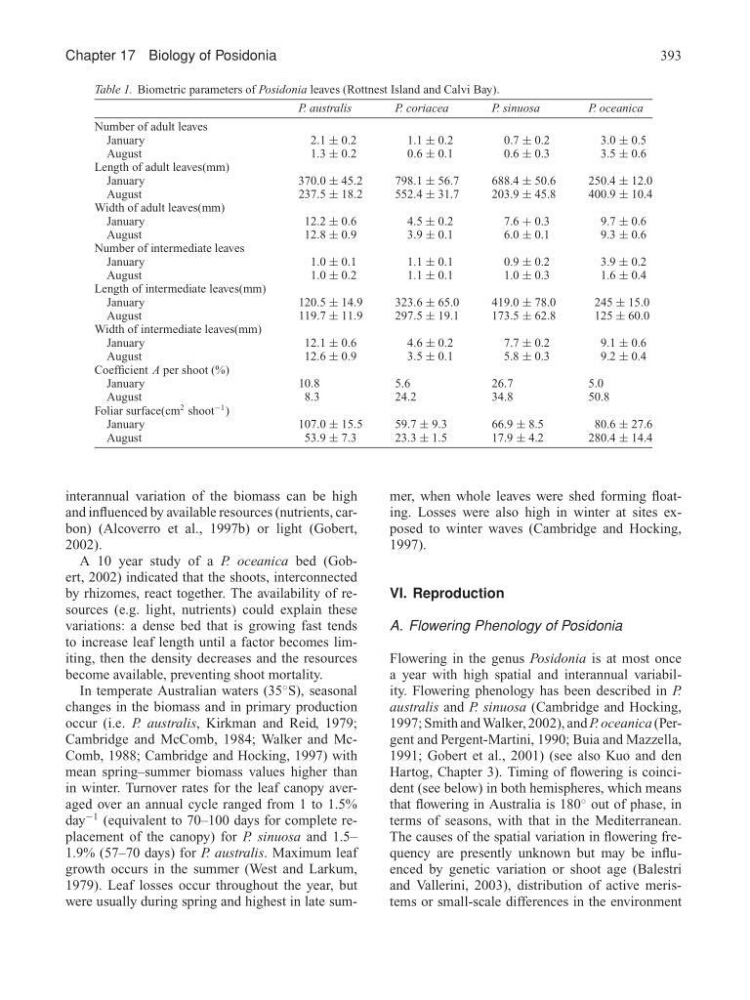
Table 1. Biometric parameters of Posidonia leaves (Rottnest Island and Calvi Bay).
P. australis
P . coriacea
P. sinuosa
P. oceanica
Number of adult leaves
January
2.1 ± 0.2
1.1 ± 0.2
0.7 ± 0.2
3.0 ± 0.5
August
1.3 ± 0.2
0.6 ± 0.1
0.6 ± 0.3
3.5 ± 0.6
Length of adult leaves(mm)
January
370.0 ± 45.2
798.1 ± 56.7
688.4 ± 50.6
250.4 ± 12.0
August
237.5 ± 18.2
552.4 ± 31.7
203.9 ± 45.8
400.9 ± 10.4
Width of adult leaves(mm)
January
12.2 ± 0.6
4.5 ± 0.2
7.6 + 0.3
9.7 ± 0.6
August
12.8 ± 0.9
3.9 ± 0.1
6.0 ± 0.1
9.3 ± 0.6
Number of intermediate leaves
January
1.0 ± 0.1
1.1 ± 0.1
0.9 ± 0.2
3.9 ± 0.2
August
1.0 ± 0.2
1.1 ± 0.1
1.0 ± 0.3
1.6 ± 0.4
Length of intermediate leaves(mm)
January
120.5 ± 14.9
323.6 ± 65.0
419.0 ± 78.0
245 ± 15.0
August
119.7 ± 11.9
297.5 ± 19.1
173.5 ± 62.8
125 ± 60.0
Width of intermediate leaves(mm)
January
12.1 ± 0.6
4.6 ± 0.2
7.7 ± 0.2
9.1 ± 0.6
August
12.6 ± 0.9
3.5 ± 0.1
5.8 ± 0.3
9.2 ± 0.4
Coefficient A per shoot (%)
January
10.8
5.6
26.7
5.0
August
8.3
24.2
34.8
50.8
Foliar surface(cm
2 shoot
−1 )
January
107.0 ± 15.5
59.7 ± 9.3
66.9 ± 8.5
80.6 ± 27.6
August
53.9 ± 7.3
23.3 ± 1.5
17.9 ± 4.2
280.4 ± 14.4
interannual variation of the biomass can be high
and influenced by available resources (nutrients, carbon) (Alcoverro et al., 1997b) or light (Gobert,
2002).
A 10 year study of a P. oceanica bed (Gobert, 2002) indicated that the shoots, interconnected
by rhizomes, react together. The availability of resources (e.g. light, nutrients) could explain these
variations: a dense bed that is growing fast tends
to increase leaf length until a factor becomes limiting, then the density decreases and the resources
become available, preventing shoot mortality.
In temperate Australian waters (35
◦ S), seasonal
changes in the biomass and in primary production
occur (i.e. P. australis, Kirkman and Reid, 1979;
Cambridge and McComb, 1984; Walker and McComb, 1988; Cambridge and Hocking, 1997) with
mean spring–summer biomass values higher than
in winter. Turnover rates for the leaf canopy averaged over an annual cycle ranged from 1 to 1.5%
day
−1 (equivalent to 70–100 days for complete replacement of the canopy) for P. sinuosa and 1.5–
1.9% (57–70 days) for P. australis. Maximum leaf
growth occurs in the summer (West and Larkum,
1979). Leaf losses occur throughout the year, but
were usually during spring and highest in late summer, when whole leaves were shed forming floating. Losses were also high in winter at sites exposed to winter waves (Cambridge and Hocking,
1997).
VI. Reproduction
A. Flowering Phenology of Posidonia
Flowering in the genus Posidonia is at most once
a year with high spatial and interannual variability. Flowering phenology has been described in P.
australis and P. sinuosa (Cambridge and Hocking,
1997; Smith and Walker, 2002), and P. oceanica (Pergent and Pergent-Martini, 1990; Buia and Mazzella,
1991; Gobert et al., 2001) (see also Kuo and den
Hartog, Chapter 3). Timing of flowering is coincident (see below) in both hemispheres, which means
that flowering in Australia is 180
◦ out of phase, in
terms of seasons, with that in the Mediterranean.
The causes of the spatial variation in flowering frequency are presently unknown but may be influenced by genetic variation or shoot age (Balestri
and Vallerini, 2003), distribution of active meristems or small-scale differences in the environment
393
Table 1. Biometric parameters of Posidonia leaves (Rottnest Island and Calvi Bay).
P. australis
P . coriacea
P. sinuosa
P. oceanica
Number of adult leaves
January
2.1 ± 0.2
1.1 ± 0.2
0.7 ± 0.2
3.0 ± 0.5
August
1.3 ± 0.2
0.6 ± 0.1
0.6 ± 0.3
3.5 ± 0.6
Length of adult leaves(mm)
January
370.0 ± 45.2
798.1 ± 56.7
688.4 ± 50.6
250.4 ± 12.0
August
237.5 ± 18.2
552.4 ± 31.7
203.9 ± 45.8
400.9 ± 10.4
Width of adult leaves(mm)
January
12.2 ± 0.6
4.5 ± 0.2
7.6 + 0.3
9.7 ± 0.6
August
12.8 ± 0.9
3.9 ± 0.1
6.0 ± 0.1
9.3 ± 0.6
Number of intermediate leaves
January
1.0 ± 0.1
1.1 ± 0.1
0.9 ± 0.2
3.9 ± 0.2
August
1.0 ± 0.2
1.1 ± 0.1
1.0 ± 0.3
1.6 ± 0.4
Length of intermediate leaves(mm)
January
120.5 ± 14.9
323.6 ± 65.0
419.0 ± 78.0
245 ± 15.0
August
119.7 ± 11.9
297.5 ± 19.1
173.5 ± 62.8
125 ± 60.0
Width of intermediate leaves(mm)
January
12.1 ± 0.6
4.6 ± 0.2
7.7 ± 0.2
9.1 ± 0.6
August
12.6 ± 0.9
3.5 ± 0.1
5.8 ± 0.3
9.2 ± 0.4
Coefficient A per shoot (%)
January
10.8
5.6
26.7
5.0
August
8.3
24.2
34.8
50.8
Foliar surface(cm
2 shoot
−1 )
January
107.0 ± 15.5
59.7 ± 9.3
66.9 ± 8.5
80.6 ± 27.6
August
53.9 ± 7.3
23.3 ± 1.5
17.9 ± 4.2
280.4 ± 14.4
interannual variation of the biomass can be high
and influenced by available resources (nutrients, carbon) (Alcoverro et al., 1997b) or light (Gobert,
2002).
A 10 year study of a P. oceanica bed (Gobert, 2002) indicated that the shoots, interconnected
by rhizomes, react together. The availability of resources (e.g. light, nutrients) could explain these
variations: a dense bed that is growing fast tends
to increase leaf length until a factor becomes limiting, then the density decreases and the resources
become available, preventing shoot mortality.
In temperate Australian waters (35
◦ S), seasonal
changes in the biomass and in primary production
occur (i.e. P. australis, Kirkman and Reid, 1979;
Cambridge and McComb, 1984; Walker and McComb, 1988; Cambridge and Hocking, 1997) with
mean spring–summer biomass values higher than
in winter. Turnover rates for the leaf canopy averaged over an annual cycle ranged from 1 to 1.5%
day
−1 (equivalent to 70–100 days for complete replacement of the canopy) for P. sinuosa and 1.5–
1.9% (57–70 days) for P. australis. Maximum leaf
growth occurs in the summer (West and Larkum,
1979). Leaf losses occur throughout the year, but
were usually during spring and highest in late summer, when whole leaves were shed forming floating. Losses were also high in winter at sites exposed to winter waves (Cambridge and Hocking,
1997).
VI. Reproduction
A. Flowering Phenology of Posidonia
Flowering in the genus Posidonia is at most once
a year with high spatial and interannual variability. Flowering phenology has been described in P.
australis and P. sinuosa (Cambridge and Hocking,
1997; Smith and Walker, 2002), and P. oceanica (Pergent and Pergent-Martini, 1990; Buia and Mazzella,
1991; Gobert et al., 2001) (see also Kuo and den
Hartog, Chapter 3). Timing of flowering is coincident (see below) in both hemispheres, which means
that flowering in Australia is 180
◦ out of phase, in
terms of seasons, with that in the Mediterranean.
The causes of the spatial variation in flowering frequency are presently unknown but may be influenced by genetic variation or shoot age (Balestri
and Vallerini, 2003), distribution of active meristems or small-scale differences in the environment