

Chapter 7 Carbon Flux in Seagrasses
167
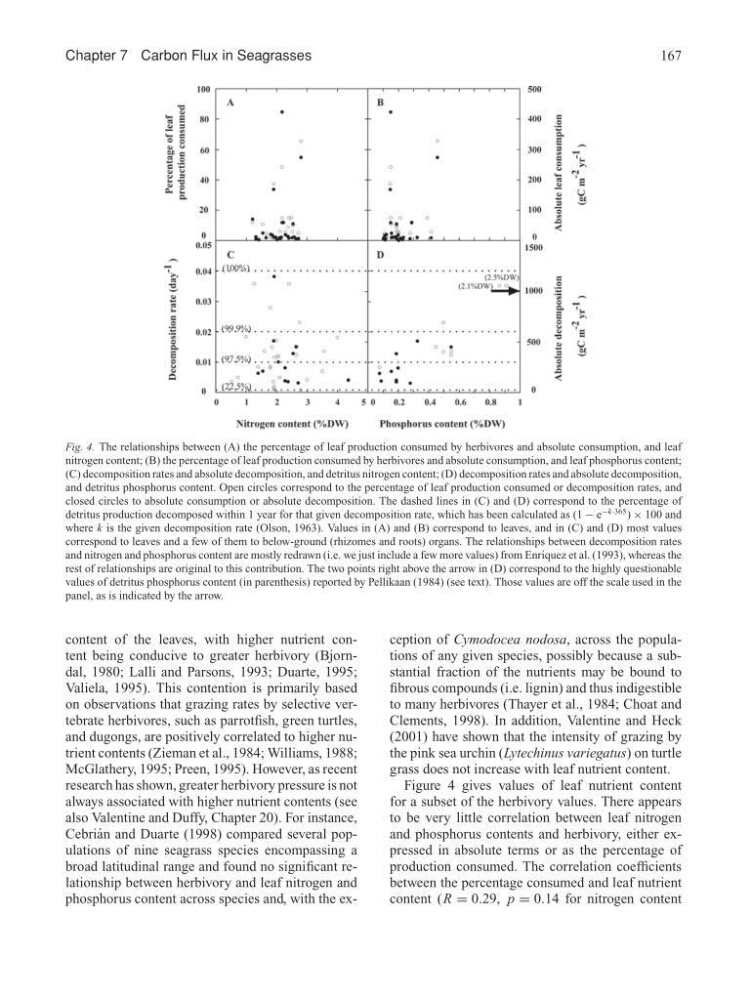
Fig. 4. The relationships between (A) the percentage of leaf production consumed by herbivores and absolute consumption, and leaf
nitrogen content; (B) the percentage of leaf production consumed by herbivores and absolute consumption, and leaf phosphorus content;
(C) decomposition rates and absolute decomposition, and detritus nitrogen content; (D) decomposition rates and absolute decomposition,
and detritus phosphorus content. Open circles correspond to the percentage of leaf production consumed or decomposition rates, and
closed circles to absolute consumption or absolute decomposition. The dashed lines in (C) and (D) correspond to the percentage of
detritus production decomposed within 1 year for that given decomposition rate, which has been calculated as (1 − e
−k·365 ) × 100 and
where k is the given decomposition rate (Olson, 1963). Values in (A) and (B) correspond to leaves, and in (C) and (D) most values
correspond to leaves and a few of them to below-ground (rhizomes and roots) organs. The relationships between decomposition rates
and nitrogen and phosphorus content are mostly redrawn (i.e. we just include a few more values) from Enr´ ıquez et al. (1993), whereas the
rest of relationships are original to this contribution. The two points right above the arrow in (D) correspond to the highly questionable
values of detritus phosphorus content (in parenthesis) reported by Pellikaan (1984) (see text). Those values are off the scale used in the
panel, as is indicated by the arrow.
content of the leaves, with higher nutrient content being conducive to greater herbivory (Bjorndal, 1980; Lalli and Parsons, 1993; Duarte, 1995;
Valiela, 1995). This contention is primarily based
on observations that grazing rates by selective vertebrate herbivores, such as parrotfish, green turtles,
and dugongs, are positively correlated to higher nutrient contents (Zieman et al., 1984; Williams, 1988;
McGlathery, 1995; Preen, 1995). However, as recent
research has shown, greater herbivory pressure is not
always associated with higher nutrient contents (see
also Valentine and Duffy, Chapter 20). For instance,
Cebri´ an and Duarte (1998) compared several populations of nine seagrass species encompassing a
broad latitudinal range and found no significant relationship between herbivory and leaf nitrogen and
phosphorus content across species and, with the exception of Cymodocea nodosa, across the populations of any given species, possibly because a substantial fraction of the nutrients may be bound to
fibrous compounds (i.e. lignin) and thus indigestible
to many herbivores (Thayer et al., 1984; Choat and
Clements, 1998). In addition, Valentine and Heck
(2001) have shown that the intensity of grazing by
the pink sea urchin (Lytechinus variegatus) on turtle
grass does not increase with leaf nutrient content.
Figure 4 gives values of leaf nutrient content
for a subset of the herbivory values. There appears
to be very little correlation between leaf nitrogen
and phosphorus contents and herbivory, either expressed in absolute terms or as the percentage of
production consumed. The correlation coefficients
between the percentage consumed and leaf nutrient
content (R = 0.29, p = 0.14 for nitrogen content
167
Fig. 4. The relationships between (A) the percentage of leaf production consumed by herbivores and absolute consumption, and leaf
nitrogen content; (B) the percentage of leaf production consumed by herbivores and absolute consumption, and leaf phosphorus content;
(C) decomposition rates and absolute decomposition, and detritus nitrogen content; (D) decomposition rates and absolute decomposition,
and detritus phosphorus content. Open circles correspond to the percentage of leaf production consumed or decomposition rates, and
closed circles to absolute consumption or absolute decomposition. The dashed lines in (C) and (D) correspond to the percentage of
detritus production decomposed within 1 year for that given decomposition rate, which has been calculated as (1 − e
−k·365 ) × 100 and
where k is the given decomposition rate (Olson, 1963). Values in (A) and (B) correspond to leaves, and in (C) and (D) most values
correspond to leaves and a few of them to below-ground (rhizomes and roots) organs. The relationships between decomposition rates
and nitrogen and phosphorus content are mostly redrawn (i.e. we just include a few more values) from Enr´ ıquez et al. (1993), whereas the
rest of relationships are original to this contribution. The two points right above the arrow in (D) correspond to the highly questionable
values of detritus phosphorus content (in parenthesis) reported by Pellikaan (1984) (see text). Those values are off the scale used in the
panel, as is indicated by the arrow.
content of the leaves, with higher nutrient content being conducive to greater herbivory (Bjorndal, 1980; Lalli and Parsons, 1993; Duarte, 1995;
Valiela, 1995). This contention is primarily based
on observations that grazing rates by selective vertebrate herbivores, such as parrotfish, green turtles,
and dugongs, are positively correlated to higher nutrient contents (Zieman et al., 1984; Williams, 1988;
McGlathery, 1995; Preen, 1995). However, as recent
research has shown, greater herbivory pressure is not
always associated with higher nutrient contents (see
also Valentine and Duffy, Chapter 20). For instance,
Cebri´ an and Duarte (1998) compared several populations of nine seagrass species encompassing a
broad latitudinal range and found no significant relationship between herbivory and leaf nitrogen and
phosphorus content across species and, with the exception of Cymodocea nodosa, across the populations of any given species, possibly because a substantial fraction of the nutrients may be bound to
fibrous compounds (i.e. lignin) and thus indigestible
to many herbivores (Thayer et al., 1984; Choat and
Clements, 1998). In addition, Valentine and Heck
(2001) have shown that the intensity of grazing by
the pink sea urchin (Lytechinus variegatus) on turtle
grass does not increase with leaf nutrient content.
Figure 4 gives values of leaf nutrient content
for a subset of the herbivory values. There appears
to be very little correlation between leaf nitrogen
and phosphorus contents and herbivory, either expressed in absolute terms or as the percentage of
production consumed. The correlation coefficients
between the percentage consumed and leaf nutrient
content (R = 0.29, p = 0.14 for nitrogen content