

8
C
.. N02-N Y= 11.706 '10'(-3_0403.-2x) R'2=0_952
• N03-N Y= 41.495 • lO'(-3.2113e-2x)
R'2=0.991
o NH.-N y=43.625.10'(-4.129ge-2x)
R'2=o.964
• PO.-p Y= 42.724' lO'(-7.5455<>-2x)
R'2=0.886
120
Time (hours)
240
A
413
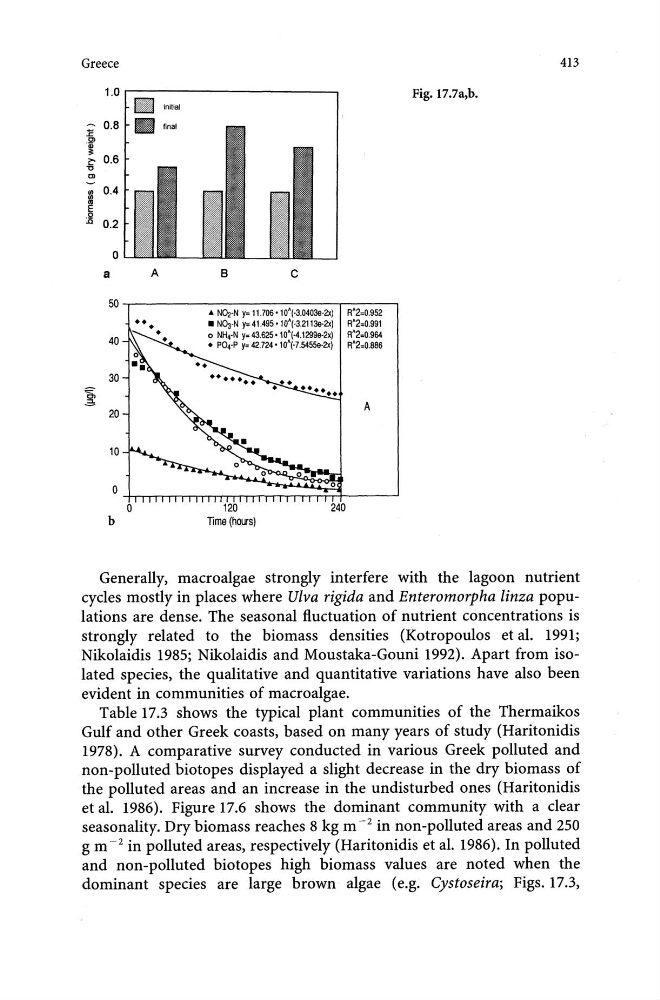
Fig. 17.7a,b.
Generally, macroalgae strongly interfere with the lagoon nutrient
cycles mostly in places where Ulva rigida and Enteromorpha linza populations are dense. The seasonal fluctuation of nutrient concentrations is
strongly related to the biomass densities (Kotropoulos et aL 1991;
Nikolaidis 1985; Nikolaidis and Moustaka-Gouni 1992). Apart from isolated species, the qualitative and quantitative variations have also been
evident in communities of macroalgae.
Table 17.3 shows the typical plant communities of the Thermaikos
Gulf and other Greek coasts, based on many years of study (Haritonidis
1978). A comparative survey conducted in various Greek polluted and
non-polluted biotopes displayed a slight decrease in the dry biomass of
the polluted areas and an increase in the undisturbed ones (Haritonidis
et al. 1986). Figure 17.6 shows the dominant community with a clear
seasonality. Dry biomass reaches 8 kg m -2 in non-polluted areas and 250
g m -2 in polluted areas, respectively (Haritonidis et al. 1986). In polluted
and non-polluted biotopes high biomass values are noted when the
dominant species are large brown algae (e.g. Cystoseira; Figs. 17.3,
C
.. N02-N Y= 11.706 '10'(-3_0403.-2x) R'2=0_952
• N03-N Y= 41.495 • lO'(-3.2113e-2x)
R'2=0.991
o NH.-N y=43.625.10'(-4.129ge-2x)
R'2=o.964
• PO.-p Y= 42.724' lO'(-7.5455<>-2x)
R'2=0.886
120
Time (hours)
240
A
413
Fig. 17.7a,b.
Generally, macroalgae strongly interfere with the lagoon nutrient
cycles mostly in places where Ulva rigida and Enteromorpha linza populations are dense. The seasonal fluctuation of nutrient concentrations is
strongly related to the biomass densities (Kotropoulos et aL 1991;
Nikolaidis 1985; Nikolaidis and Moustaka-Gouni 1992). Apart from isolated species, the qualitative and quantitative variations have also been
evident in communities of macroalgae.
Table 17.3 shows the typical plant communities of the Thermaikos
Gulf and other Greek coasts, based on many years of study (Haritonidis
1978). A comparative survey conducted in various Greek polluted and
non-polluted biotopes displayed a slight decrease in the dry biomass of
the polluted areas and an increase in the undisturbed ones (Haritonidis
et al. 1986). Figure 17.6 shows the dominant community with a clear
seasonality. Dry biomass reaches 8 kg m -2 in non-polluted areas and 250
g m -2 in polluted areas, respectively (Haritonidis et al. 1986). In polluted
and non-polluted biotopes high biomass values are noted when the
dominant species are large brown algae (e.g. Cystoseira; Figs. 17.3,