

270
m
2.0
1.5
1.0
0.5
o
m 1.0
0.75
0.50
0.25
10
20
30
- 2
gm
3
40
50
m
2.0
1.5
1.0
0.5
o
10
o ~--~--~----'----T--~ ~~~-----------l
2
-2 3
gx100cm
4
5
20
F.X. Niell et al.
30
- z
gm
40
50
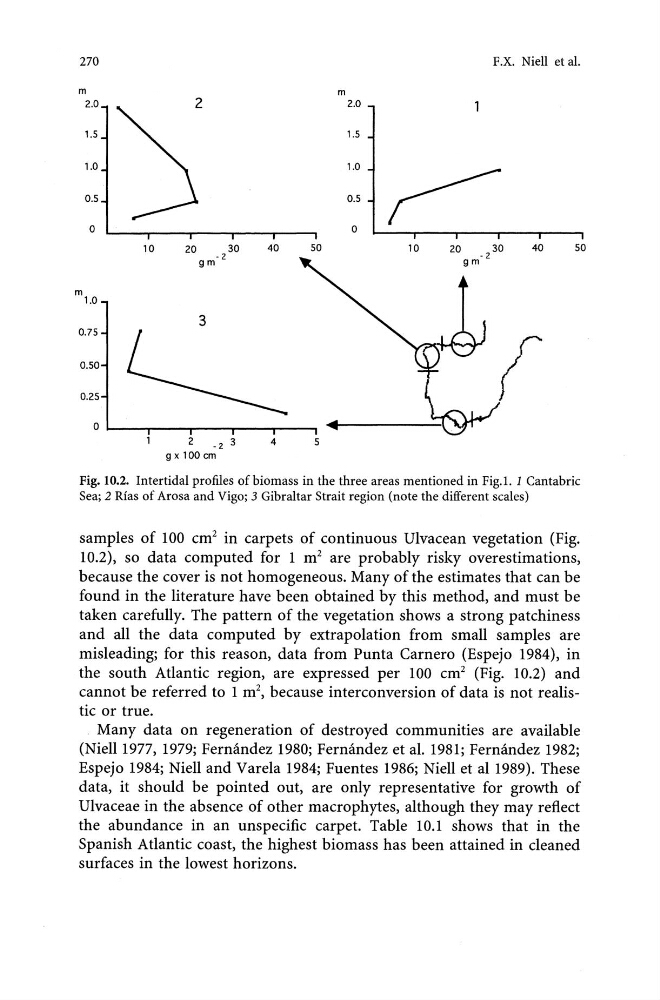
Fig. 10.2. Intertidal profiles of biomass in the three areas mentioned in Fig.I. 1 Cantabric
Sea; 2 Rias of Arosa and Vigo; 3 Gibraltar Strait region (note the different scales)
samples of 100 cm 2 in carpets of continuous Ulvacean vegetation (Fig.
10.2), so data computed for 1 m 2 are probably risky overestimations,
because the cover is not homogeneous. Many of the estimates that can be
found in the literature have been obtained by this method, and must be
taken carefully. The pattern of the vegetation shows a strong patchiness
and all the data computed by extrapolation from small samples are
misleading; for this reason, data from Punta Carnero (Espejo 1984), in
the south Atlantic region, are expressed per 100 cm 2 (Fig. 10.2) and
cannot be referred to 1 m 2 , because interconversion of data is not realistic or true.
Many data on regeneration of destroyed communities are available
(NielI1977, 1979; Fernandez 1980; Fernandez et al. 1981; Fernandez 1982;
Espejo 1984; Niell and Varela 1984; Fuentes 1986; Niell et aI1989). These
data, it should be pointed out, are only representative for growth of
Ulvaceae in the absence of other macrophytes, although they may reflect
the abundance in an unspecific carpet. Table 10.1 shows that in the
Spanish Atlantic coast, the highest biomass has been attained in cleaned
surfaces in the lowest horizons.
m
2.0
1.5
1.0
0.5
o
m 1.0
0.75
0.50
0.25
10
20
30
- 2
gm
3
40
50
m
2.0
1.5
1.0
0.5
o
10
o ~--~--~----'----T--~ ~~~-----------l
2
-2 3
gx100cm
4
5
20
F.X. Niell et al.
30
- z
gm
40
50
Fig. 10.2. Intertidal profiles of biomass in the three areas mentioned in Fig.I. 1 Cantabric
Sea; 2 Rias of Arosa and Vigo; 3 Gibraltar Strait region (note the different scales)
samples of 100 cm 2 in carpets of continuous Ulvacean vegetation (Fig.
10.2), so data computed for 1 m 2 are probably risky overestimations,
because the cover is not homogeneous. Many of the estimates that can be
found in the literature have been obtained by this method, and must be
taken carefully. The pattern of the vegetation shows a strong patchiness
and all the data computed by extrapolation from small samples are
misleading; for this reason, data from Punta Carnero (Espejo 1984), in
the south Atlantic region, are expressed per 100 cm 2 (Fig. 10.2) and
cannot be referred to 1 m 2 , because interconversion of data is not realistic or true.
Many data on regeneration of destroyed communities are available
(NielI1977, 1979; Fernandez 1980; Fernandez et al. 1981; Fernandez 1982;
Espejo 1984; Niell and Varela 1984; Fuentes 1986; Niell et aI1989). These
data, it should be pointed out, are only representative for growth of
Ulvaceae in the absence of other macrophytes, although they may reflect
the abundance in an unspecific carpet. Table 10.1 shows that in the
Spanish Atlantic coast, the highest biomass has been attained in cleaned
surfaces in the lowest horizons.