

Increase in Atmospheric CO 2
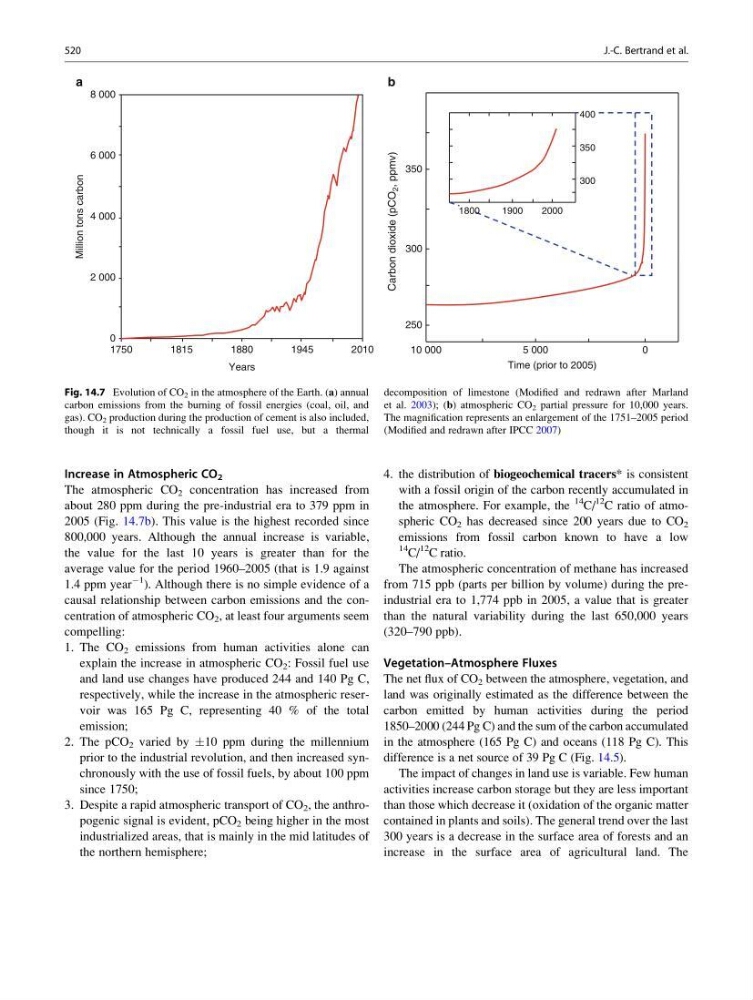
The atmospheric CO 2 concentration has increased from
about 280 ppm during the pre-industrial era to 379 ppm in
2005 (Fig. 14.7b). This value is the highest recorded since
800,000 years. Although the annual increase is variable,
the value for the last 10 years is greater than for the
average value for the period 1960–2005 (that is 1.9 against
1.4 ppm year
À1 ). Although there is no simple evidence of a
causal relationship between carbon emissions and the concentration of atmospheric CO 2 , at least four arguments seem
compelling:
1. The CO 2 emissions from human activities alone can
explain the increase in atmospheric CO 2 : Fossil fuel use
and land use changes have produced 244 and 140 Pg C,
respectively, while the increase in the atmospheric reservoir was 165 Pg C, representing 40 % of the total
emission;
2. The pCO 2 varied by Æ10 ppm during the millennium
prior to the industrial revolution, and then increased synchronously with the use of fossil fuels, by about 100 ppm
since 1750;
3. Despite a rapid atmospheric transport of CO 2 , the anthropogenic signal is evident, pCO 2 being higher in the most
industrialized areas, that is mainly in the mid latitudes of
the northern hemisphere;
4. the distribution of biogeochemical tracers* is consistent
with a fossil origin of the carbon recently accumulated in
the atmosphere. For example, the
14
C/
12
C ratio of atmospheric CO 2 has decreased since 200 years due to CO 2
emissions from fossil carbon known to have a low
14
C/
12
C ratio.
The atmospheric concentration of methane has increased
from 715 ppb (parts per billion by volume) during the preindustrial era to 1,774 ppb in 2005, a value that is greater
than the natural variability during the last 650,000 years
(320–790 ppb).
Vegetation–Atmosphere Fluxes
The net flux of CO 2 between the atmosphere, vegetation, and
land was originally estimated as the difference between the
carbon emitted by human activities during the period
1850–2000 (244 Pg C) and the sum of the carbon accumulated
in the atmosphere (165 Pg C) and oceans (118 Pg C). This
difference is a net source of 39 Pg C (Fig. 14.5).
The impact of changes in land use is variable. Few human
activities increase carbon storage but they are less important
than those which decrease it (oxidation of the organic matter
contained in plants and soils). The general trend over the last
300 years is a decrease in the surface area of forests and an
increase in the surface area of agricultural land. The
8 000
6 000
4 000
2 000
0
1750
1815
1880
1945
2010
Years
Million tons carbon
0
5 000
10 000
350
300
250
2000
1900
350
300
Time (prior to 2005)
Carbon dioxide (pCO
2 , ppmv)
1800
400
a
b
Fig. 14.7 Evolution of CO 2 in the atmosphere of the Earth. (a) annual
carbon emissions from the burning of fossil energies (coal, oil, and
gas). CO 2 production during the production of cement is also included,
though it is not technically a fossil fuel use, but a thermal
decomposition of limestone (Modified and redrawn after Marland
et al. 2003); (b) atmospheric CO 2 partial pressure for 10,000 years.
The magnification represents an enlargement of the 1751–2005 period
(Modified and redrawn after IPCC 2007)
520
J.-C. Bertrand et al.
The atmospheric CO 2 concentration has increased from
about 280 ppm during the pre-industrial era to 379 ppm in
2005 (Fig. 14.7b). This value is the highest recorded since
800,000 years. Although the annual increase is variable,
the value for the last 10 years is greater than for the
average value for the period 1960–2005 (that is 1.9 against
1.4 ppm year
À1 ). Although there is no simple evidence of a
causal relationship between carbon emissions and the concentration of atmospheric CO 2 , at least four arguments seem
compelling:
1. The CO 2 emissions from human activities alone can
explain the increase in atmospheric CO 2 : Fossil fuel use
and land use changes have produced 244 and 140 Pg C,
respectively, while the increase in the atmospheric reservoir was 165 Pg C, representing 40 % of the total
emission;
2. The pCO 2 varied by Æ10 ppm during the millennium
prior to the industrial revolution, and then increased synchronously with the use of fossil fuels, by about 100 ppm
since 1750;
3. Despite a rapid atmospheric transport of CO 2 , the anthropogenic signal is evident, pCO 2 being higher in the most
industrialized areas, that is mainly in the mid latitudes of
the northern hemisphere;
4. the distribution of biogeochemical tracers* is consistent
with a fossil origin of the carbon recently accumulated in
the atmosphere. For example, the
14
C/
12
C ratio of atmospheric CO 2 has decreased since 200 years due to CO 2
emissions from fossil carbon known to have a low
14
C/
12
C ratio.
The atmospheric concentration of methane has increased
from 715 ppb (parts per billion by volume) during the preindustrial era to 1,774 ppb in 2005, a value that is greater
than the natural variability during the last 650,000 years
(320–790 ppb).
Vegetation–Atmosphere Fluxes
The net flux of CO 2 between the atmosphere, vegetation, and
land was originally estimated as the difference between the
carbon emitted by human activities during the period
1850–2000 (244 Pg C) and the sum of the carbon accumulated
in the atmosphere (165 Pg C) and oceans (118 Pg C). This
difference is a net source of 39 Pg C (Fig. 14.5).
The impact of changes in land use is variable. Few human
activities increase carbon storage but they are less important
than those which decrease it (oxidation of the organic matter
contained in plants and soils). The general trend over the last
300 years is a decrease in the surface area of forests and an
increase in the surface area of agricultural land. The
8 000
6 000
4 000
2 000
0
1750
1815
1880
1945
2010
Years
Million tons carbon
0
5 000
10 000
350
300
250
2000
1900
350
300
Time (prior to 2005)
Carbon dioxide (pCO
2 , ppmv)
1800
400
a
b
Fig. 14.7 Evolution of CO 2 in the atmosphere of the Earth. (a) annual
carbon emissions from the burning of fossil energies (coal, oil, and
gas). CO 2 production during the production of cement is also included,
though it is not technically a fossil fuel use, but a thermal
decomposition of limestone (Modified and redrawn after Marland
et al. 2003); (b) atmospheric CO 2 partial pressure for 10,000 years.
The magnification represents an enlargement of the 1751–2005 period
(Modified and redrawn after IPCC 2007)
520
J.-C. Bertrand et al.