

genome of Enterobacteriales. The size of the core genome
decreases with time. Accordingly, the size of the core
genome at lower taxonomic levels (e.g., strains and species)
is expected to be greater than at higher taxonomic levels. For
instance, the core genome of Rickettsia is predicted to contain more genes than the core genome of Alphaproteobacteria as many genes present in Rickettsia may be absent
in representatives of other alphaproteobacterial genera (e.g.,
Sphingopyxis, Azorhizobium, etc.). Conversely, the size of
the pan genome increases accordingly to the taxonomic
level. The core genome is an essential notion in comparative
genomics as many microbiologists think that core genomes
define the “essence” of taxa and give them a biological
sense. This is particularly important in prokaryotes because
most taxonomic levels (including species) are defined based
on arbitrary measures (cf. Chap. 6, Box 6.1).
Even if the notion of core and pan genomes is easy to
understand, their characterization is more difficult. In particular, this asks the question of how many genomes should be
sequenced to accurately delineate these two sets of genes.
For instance, how many and which strains should be
sequenced to determine the core and the pan genome of a
species? In theory, all representatives of the species should
be taken into consideration. In practice, such a strategy is
very often not feasible. However, it is possible to estimate
the size of the core and the pan genomes of a given taxon
using bioinformatic simulations. The robustness and the
accuracy of such estimations increases as the number of
genomes compared increases. For instance, if a single
genome is considered to represent a given taxon, it will
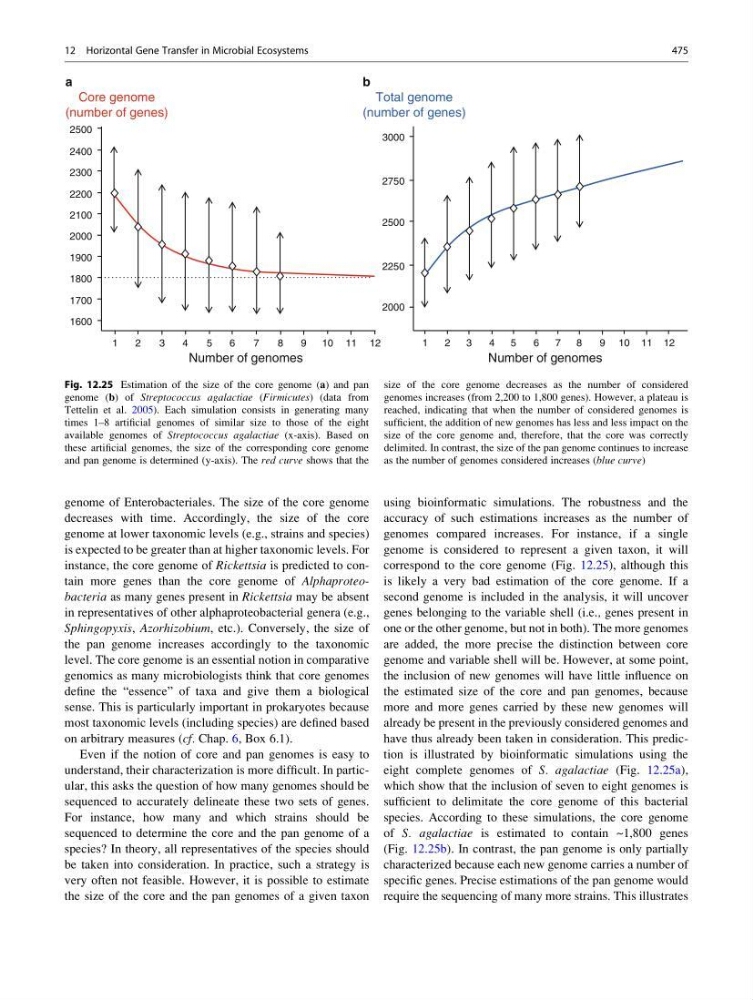
correspond to the core genome (Fig. 12.25), although this
is likely a very bad estimation of the core genome. If a
second genome is included in the analysis, it will uncover
genes belonging to the variable shell (i.e., genes present in
one or the other genome, but not in both). The more genomes
are added, the more precise the distinction between core
genome and variable shell will be. However, at some point,
the inclusion of new genomes will have little influence on
the estimated size of the core and pan genomes, because
more and more genes carried by these new genomes will
already be present in the previously considered genomes and
have thus already been taken in consideration. This prediction is illustrated by bioinformatic simulations using the
eight complete genomes of S. agalactiae (Fig. 12.25a),
which show that the inclusion of seven to eight genomes is
sufficient to delimitate the core genome of this bacterial
species. According to these simulations, the core genome
of S. agalactiae is estimated to contain ~1,800 genes
(Fig. 12.25b). In contrast, the pan genome is only partially
characterized because each new genome carries a number of
specific genes. Precise estimations of the pan genome would
require the sequencing of many more strains. This illustrates
Number of genomes
Core genome
(number of genes)
12
11
10
9
8
7
6
5
4
3
2
1
1600
1700
1800
1900
2000
2100
2200
2300
2400
2500
Number of genomes
Total genome
(number of genes)
12
11
10
9
8
7
6
5
4
3
2
1
2000
2250
2500
2750
3000
a
b
Fig. 12.25 Estimation of the size of the core genome (a) and pan
genome (b) of Streptococcus agalactiae (Firmicutes) (data from
Tettelin et al. 2005). Each simulation consists in generating many
times 1–8 artificial genomes of similar size to those of the eight
available genomes of Streptococcus agalactiae (x-axis). Based on
these artificial genomes, the size of the corresponding core genome
and pan genome is determined (y-axis). The red curve shows that the
size of the core genome decreases as the number of considered
genomes increases (from 2,200 to 1,800 genes). However, a plateau is
reached, indicating that when the number of considered genomes is
sufficient, the addition of new genomes has less and less impact on the
size of the core genome and, therefore, that the core was correctly
delimited. In contrast, the size of the pan genome continues to increase
as the number of genomes considered increases (blue curve)
12 Horizontal Gene Transfer in Microbial Ecosystems
475
decreases with time. Accordingly, the size of the core
genome at lower taxonomic levels (e.g., strains and species)
is expected to be greater than at higher taxonomic levels. For
instance, the core genome of Rickettsia is predicted to contain more genes than the core genome of Alphaproteobacteria as many genes present in Rickettsia may be absent
in representatives of other alphaproteobacterial genera (e.g.,
Sphingopyxis, Azorhizobium, etc.). Conversely, the size of
the pan genome increases accordingly to the taxonomic
level. The core genome is an essential notion in comparative
genomics as many microbiologists think that core genomes
define the “essence” of taxa and give them a biological
sense. This is particularly important in prokaryotes because
most taxonomic levels (including species) are defined based
on arbitrary measures (cf. Chap. 6, Box 6.1).
Even if the notion of core and pan genomes is easy to
understand, their characterization is more difficult. In particular, this asks the question of how many genomes should be
sequenced to accurately delineate these two sets of genes.
For instance, how many and which strains should be
sequenced to determine the core and the pan genome of a
species? In theory, all representatives of the species should
be taken into consideration. In practice, such a strategy is
very often not feasible. However, it is possible to estimate
the size of the core and the pan genomes of a given taxon
using bioinformatic simulations. The robustness and the
accuracy of such estimations increases as the number of
genomes compared increases. For instance, if a single
genome is considered to represent a given taxon, it will
correspond to the core genome (Fig. 12.25), although this
is likely a very bad estimation of the core genome. If a
second genome is included in the analysis, it will uncover
genes belonging to the variable shell (i.e., genes present in
one or the other genome, but not in both). The more genomes
are added, the more precise the distinction between core
genome and variable shell will be. However, at some point,
the inclusion of new genomes will have little influence on
the estimated size of the core and pan genomes, because
more and more genes carried by these new genomes will
already be present in the previously considered genomes and
have thus already been taken in consideration. This prediction is illustrated by bioinformatic simulations using the
eight complete genomes of S. agalactiae (Fig. 12.25a),
which show that the inclusion of seven to eight genomes is
sufficient to delimitate the core genome of this bacterial
species. According to these simulations, the core genome
of S. agalactiae is estimated to contain ~1,800 genes
(Fig. 12.25b). In contrast, the pan genome is only partially
characterized because each new genome carries a number of
specific genes. Precise estimations of the pan genome would
require the sequencing of many more strains. This illustrates
Number of genomes
Core genome
(number of genes)
12
11
10
9
8
7
6
5
4
3
2
1
1600
1700
1800
1900
2000
2100
2200
2300
2400
2500
Number of genomes
Total genome
(number of genes)
12
11
10
9
8
7
6
5
4
3
2
1
2000
2250
2500
2750
3000
a
b
Fig. 12.25 Estimation of the size of the core genome (a) and pan
genome (b) of Streptococcus agalactiae (Firmicutes) (data from
Tettelin et al. 2005). Each simulation consists in generating many
times 1–8 artificial genomes of similar size to those of the eight
available genomes of Streptococcus agalactiae (x-axis). Based on
these artificial genomes, the size of the corresponding core genome
and pan genome is determined (y-axis). The red curve shows that the
size of the core genome decreases as the number of considered
genomes increases (from 2,200 to 1,800 genes). However, a plateau is
reached, indicating that when the number of considered genomes is
sufficient, the addition of new genomes has less and less impact on the
size of the core genome and, therefore, that the core was correctly
delimited. In contrast, the size of the pan genome continues to increase
as the number of genomes considered increases (blue curve)
12 Horizontal Gene Transfer in Microbial Ecosystems
475