

from the genomic DNA of the host, meaning that the detection
of HGT based on genomic features becomes ineffective. Studies conducted on E. coli suggest that only the most recent
HGTs (<10 million years) can be detected efficiently by
these approaches, even if it has been proposed that a few
older HGT events (up to 100 million years) could still be
detected (Lawrence and Ochman 1997).
12.3.5 Quantification
As detailed in the previous section, many methods of HGT
detection have been implemented. They have been used
extensively to quantify this phenomenon in prokaryotes.
For instance, applying methods based on the taxonomic
distribution (cf. Sect. 12.3.2) to the comparison of genomes
of five Salmonella strains (Gammaproteobacteria): S.
enterica subsp. typhimurium (LT2 strains and S21), S.
enterica subsp. enterica serovar Typhi (M229), S. enterica
subsp. enterica serovar Muenchen (S71), and S. enterica
subsp. enterica serovar Typhimurium (M321), suggests that
20 % of the genome of LT2 might be of exogenous origin
(Hayashi et al. 2001). These results are based on subtractive
hybridization experiments among the chromosomal DNA of
LT2 and the chromosomal DNA of each of the four other
Salmonella. The total size of the non-hybridized fragments
in LT2 varies from ~100 kb 1,286 kb (Lan and Reeves
1996). A more precise analysis of M321 non-hybridized
fragments indicates that they do not represent divergent (i.
e., fast evolving) regions, but that they correspond to DNA
regions actually missing in LT2. Among the 39 nonhybridized fragments that have been sequenced, 6 contain
genes with known functions and 16 have a G + C content
below 45 % (while the average G + C content of Salmonella
is around 52 %), suggesting an exogenous origin (Lan and
Reeves 1996).
The case of Salmonella is not exceptional. The comparison of closely related genomes reveals in some cases significant gene content differences. For instance, the genome of
E. coli strain O157:H7 contains 859 additional Kb compared
to the K-12 strain MG1655 (i.e., 5.5 Mb compared to
4.6 Mb, respectively) (Hayashi et al. 2001). A detailed
analysis showed that the core genome of these two strains
represents 4.1 Mb. The 1.4 Mb present in O157:H7 but
absent in K-12 represent 1,632 coding genes (including
131 genes involved in virulence) and 20 tRNA genes.
These differences in gene content were interpreted as the
consequence of recent gene acquisitions through HGT.
Strengthening this hypothesis, analyses revealed that most
of this DNA is of phage origin (Hayashi et al. 2001).
A similar study was conducted in three Frankia strains
presenting less than 2.2 % of 16S rRNA divergence
a
b
c
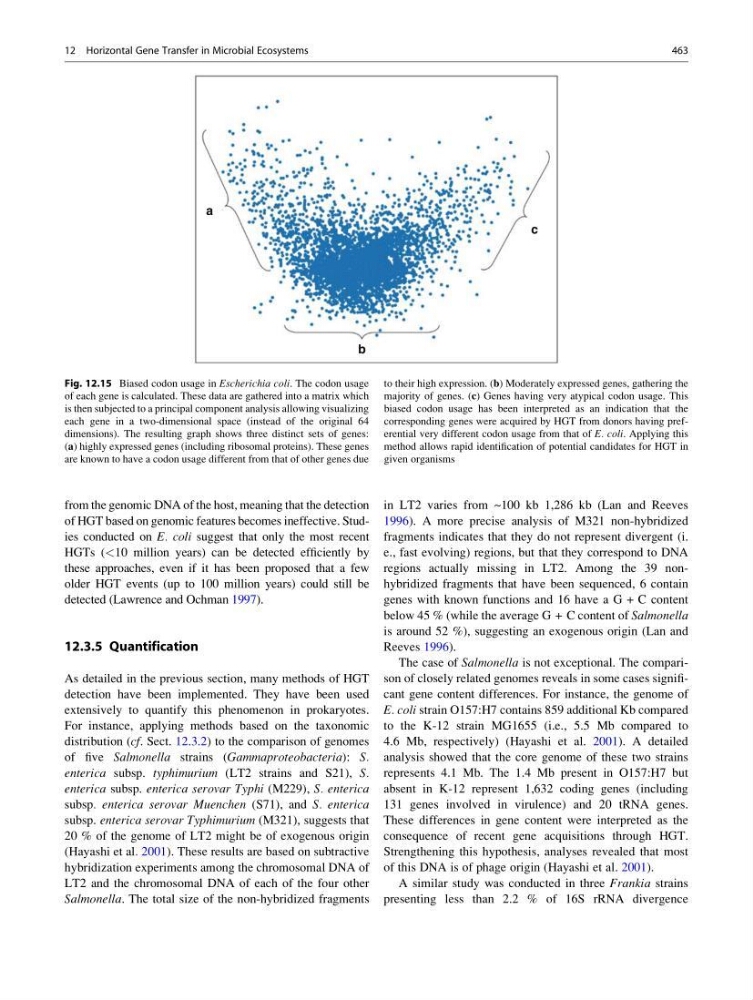
Fig. 12.15 Biased codon usage in Escherichia coli. The codon usage
of each gene is calculated. These data are gathered into a matrix which
is then subjected to a principal component analysis allowing visualizing
each gene in a two-dimensional space (instead of the original 64
dimensions). The resulting graph shows three distinct sets of genes:
(a) highly expressed genes (including ribosomal proteins). These genes
are known to have a codon usage different from that of other genes due
to their high expression. (b) Moderately expressed genes, gathering the
majority of genes. (c) Genes having very atypical codon usage. This
biased codon usage has been interpreted as an indication that the
corresponding genes were acquired by HGT from donors having preferential very different codon usage from that of E. coli. Applying this
method allows rapid identification of potential candidates for HGT in
given organisms
12 Horizontal Gene Transfer in Microbial Ecosystems
463
of HGT based on genomic features becomes ineffective. Studies conducted on E. coli suggest that only the most recent
HGTs (<10 million years) can be detected efficiently by
these approaches, even if it has been proposed that a few
older HGT events (up to 100 million years) could still be
detected (Lawrence and Ochman 1997).
12.3.5 Quantification
As detailed in the previous section, many methods of HGT
detection have been implemented. They have been used
extensively to quantify this phenomenon in prokaryotes.
For instance, applying methods based on the taxonomic
distribution (cf. Sect. 12.3.2) to the comparison of genomes
of five Salmonella strains (Gammaproteobacteria): S.
enterica subsp. typhimurium (LT2 strains and S21), S.
enterica subsp. enterica serovar Typhi (M229), S. enterica
subsp. enterica serovar Muenchen (S71), and S. enterica
subsp. enterica serovar Typhimurium (M321), suggests that
20 % of the genome of LT2 might be of exogenous origin
(Hayashi et al. 2001). These results are based on subtractive
hybridization experiments among the chromosomal DNA of
LT2 and the chromosomal DNA of each of the four other
Salmonella. The total size of the non-hybridized fragments
in LT2 varies from ~100 kb 1,286 kb (Lan and Reeves
1996). A more precise analysis of M321 non-hybridized
fragments indicates that they do not represent divergent (i.
e., fast evolving) regions, but that they correspond to DNA
regions actually missing in LT2. Among the 39 nonhybridized fragments that have been sequenced, 6 contain
genes with known functions and 16 have a G + C content
below 45 % (while the average G + C content of Salmonella
is around 52 %), suggesting an exogenous origin (Lan and
Reeves 1996).
The case of Salmonella is not exceptional. The comparison of closely related genomes reveals in some cases significant gene content differences. For instance, the genome of
E. coli strain O157:H7 contains 859 additional Kb compared
to the K-12 strain MG1655 (i.e., 5.5 Mb compared to
4.6 Mb, respectively) (Hayashi et al. 2001). A detailed
analysis showed that the core genome of these two strains
represents 4.1 Mb. The 1.4 Mb present in O157:H7 but
absent in K-12 represent 1,632 coding genes (including
131 genes involved in virulence) and 20 tRNA genes.
These differences in gene content were interpreted as the
consequence of recent gene acquisitions through HGT.
Strengthening this hypothesis, analyses revealed that most
of this DNA is of phage origin (Hayashi et al. 2001).
A similar study was conducted in three Frankia strains
presenting less than 2.2 % of 16S rRNA divergence
a
b
c
Fig. 12.15 Biased codon usage in Escherichia coli. The codon usage
of each gene is calculated. These data are gathered into a matrix which
is then subjected to a principal component analysis allowing visualizing
each gene in a two-dimensional space (instead of the original 64
dimensions). The resulting graph shows three distinct sets of genes:
(a) highly expressed genes (including ribosomal proteins). These genes
are known to have a codon usage different from that of other genes due
to their high expression. (b) Moderately expressed genes, gathering the
majority of genes. (c) Genes having very atypical codon usage. This
biased codon usage has been interpreted as an indication that the
corresponding genes were acquired by HGT from donors having preferential very different codon usage from that of E. coli. Applying this
method allows rapid identification of potential candidates for HGT in
given organisms
12 Horizontal Gene Transfer in Microbial Ecosystems
463