

features. Thus, a way to detect HGT events consists in
searching for genomic regions presenting unusual features
compared to the background of the genome (Rocha et al.
1998). In contrast to methods based on phylogeny, taxonomic distribution, or sequence similarity, the detection of
HGT based on compositional signatures does not require
external data as it is based only on the analysis of the genome
sequence of the organism under study. This is one of the
great advantages of these approaches.
12.3.4.2 Limits
Detection of HGT based on oligonucleotide compositional
signatures is easy to apply. The main problem of these
approaches is linked to the fact that even if genomes harbor
global specific features, local variations exist and can be
wrongly interpreted as the consequence of HGT. For instance,
it has been shown that the G + C content is greater in coding
regions than in intergenic regions (Rocha et al. 1998). This is at
the origin of local deviations of the oligonucleotide
frequencies observed at the genome scale. Furthermore,
HGT detection based on variation of the global codon usage
and amino acid composition can be applied only to genomic
coding regions. In addition, the codon usage and amino acid
composition vary according to the type of genes. For instance,
highly expressed genes (e.g., ribosomal proteins) present
amino acid compositions and codon usage different from
those of other proteins (Gouy and Gautier 1982) (Fig. 12.15).
Importantly, atypical nucleotide and amino acid content and
codon usage variation allow detecting especially the recent
HGT events. Indeed, over time, the transferred DNA will
acquire the characteristic of the recipient genome, because it
becomes subject to the same constraints and mutational process. As a consequence, the foreign DNA will gradually
acquire the features of the host genome. This process is called
amelioration (Lawrence and Ochman 1997). At the end,
the transferred DNA fragment will become indistinguishable
0
10
20
30
40
50
60
70
GGG (Gly)
GGA (Gly)
GGT (Gly)
GGC (Gly)
GAG (Glu)
GAA (Glu)
GAT (Asp)
GAC (Asp)
GTG (Val)
GTA (Val)
GTT (Val)
GTC (Val)
GCG (Ala)
GCA (Ala)
GCT (Ala)
GCC (Ala)
AAG (Lys)
AAA (Lys)
AAT (Asn)
AAC (Asn)
ATG (Met)
ATA (Ile)
ATT (Ile)
ATC (Ile)
ACG (Thr)
ACA (Thr)
ACT (Thr)
ACC (Thr)
TGG (Trp)
Escherichia coli APEC 01
Staphylococcus aureus Mu50
0
10
20
30
40
50
60
70
TGT (Cys)
TGC (Cys)
TGA (Stop)
TAG (Stop)
TAA (Stop)
TAT (Tyr)
TAC (Tyr)
TTT (Phe)
TTC (Phe)
TCG (Ser)
TCA (Ser)
TCT (Ser)
TCC (Ser)
AGT (Ser)
AGC (Ser)
CGG (Arg)
CGA (Arg)
CGT (Arg)
CGC (Arg)
AGG (Arg)
AGA (Arg)
CAG (Gln)
CAA (Gln)
CAT (His)
CAC (His)
CTG (Leu)
CTA (Leu)
CTT (Leu)
CTC (Leu)
TTG (Leu)
TTA (Leu)
CCG (Pro)
CCA (Pro)
CCT (Pro)
CCC (Pro)
Codons
Codons
Frequency ‰
Frequency ‰
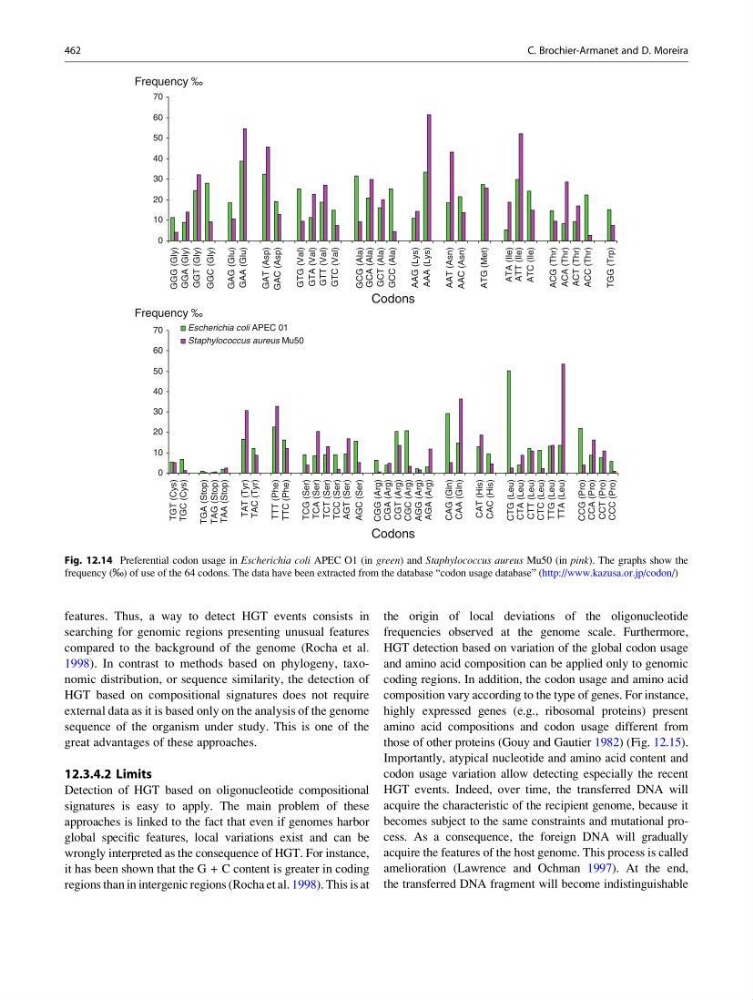
Fig. 12.14 Preferential codon usage in Escherichia coli APEC O1 (in green) and Staphylococcus aureus Mu50 (in pink). The graphs show the
frequency (‰) of use of the 64 codons. The data have been extracted from the database “codon usage database” (http://www.kazusa.or.jp/codon/)
462
C. Brochier-Armanet and D. Moreira
searching for genomic regions presenting unusual features
compared to the background of the genome (Rocha et al.
1998). In contrast to methods based on phylogeny, taxonomic distribution, or sequence similarity, the detection of
HGT based on compositional signatures does not require
external data as it is based only on the analysis of the genome
sequence of the organism under study. This is one of the
great advantages of these approaches.
12.3.4.2 Limits
Detection of HGT based on oligonucleotide compositional
signatures is easy to apply. The main problem of these
approaches is linked to the fact that even if genomes harbor
global specific features, local variations exist and can be
wrongly interpreted as the consequence of HGT. For instance,
it has been shown that the G + C content is greater in coding
regions than in intergenic regions (Rocha et al. 1998). This is at
the origin of local deviations of the oligonucleotide
frequencies observed at the genome scale. Furthermore,
HGT detection based on variation of the global codon usage
and amino acid composition can be applied only to genomic
coding regions. In addition, the codon usage and amino acid
composition vary according to the type of genes. For instance,
highly expressed genes (e.g., ribosomal proteins) present
amino acid compositions and codon usage different from
those of other proteins (Gouy and Gautier 1982) (Fig. 12.15).
Importantly, atypical nucleotide and amino acid content and
codon usage variation allow detecting especially the recent
HGT events. Indeed, over time, the transferred DNA will
acquire the characteristic of the recipient genome, because it
becomes subject to the same constraints and mutational process. As a consequence, the foreign DNA will gradually
acquire the features of the host genome. This process is called
amelioration (Lawrence and Ochman 1997). At the end,
the transferred DNA fragment will become indistinguishable
0
10
20
30
40
50
60
70
GGG (Gly)
GGA (Gly)
GGT (Gly)
GGC (Gly)
GAG (Glu)
GAA (Glu)
GAT (Asp)
GAC (Asp)
GTG (Val)
GTA (Val)
GTT (Val)
GTC (Val)
GCG (Ala)
GCA (Ala)
GCT (Ala)
GCC (Ala)
AAG (Lys)
AAA (Lys)
AAT (Asn)
AAC (Asn)
ATG (Met)
ATA (Ile)
ATT (Ile)
ATC (Ile)
ACG (Thr)
ACA (Thr)
ACT (Thr)
ACC (Thr)
TGG (Trp)
Escherichia coli APEC 01
Staphylococcus aureus Mu50
0
10
20
30
40
50
60
70
TGT (Cys)
TGC (Cys)
TGA (Stop)
TAG (Stop)
TAA (Stop)
TAT (Tyr)
TAC (Tyr)
TTT (Phe)
TTC (Phe)
TCG (Ser)
TCA (Ser)
TCT (Ser)
TCC (Ser)
AGT (Ser)
AGC (Ser)
CGG (Arg)
CGA (Arg)
CGT (Arg)
CGC (Arg)
AGG (Arg)
AGA (Arg)
CAG (Gln)
CAA (Gln)
CAT (His)
CAC (His)
CTG (Leu)
CTA (Leu)
CTT (Leu)
CTC (Leu)
TTG (Leu)
TTA (Leu)
CCG (Pro)
CCA (Pro)
CCT (Pro)
CCC (Pro)
Codons
Codons
Frequency ‰
Frequency ‰
Fig. 12.14 Preferential codon usage in Escherichia coli APEC O1 (in green) and Staphylococcus aureus Mu50 (in pink). The graphs show the
frequency (‰) of use of the 64 codons. The data have been extracted from the database “codon usage database” (http://www.kazusa.or.jp/codon/)
462
C. Brochier-Armanet and D. Moreira