

Comparison of Phenotypic or Genetic Structures
Among Samples Based on Fingerprints
Several methods like BIOLOG, DGGE, TGGE, SSCP, RISA,
and T-RFLP yield fingerprints, i.e., patterns of metabolic
levels, peaks, or bands which are characteristics of the community structure, though a given signal (e.g., a given band)
cannot be attributed to a single known taxon. To compare
these fingerprints, a range of multivariate methods can be
applied. Though ANOVA can be used, NMDS (nonmetric
multidimensional scaling) based on a Bray Curtis-like
coefficient is particularly suitable to analyze matrices including a lot of zeros and to compare samples according to the
(dis)similarity of the corresponding fingerprints. To analyze
genetic fingerprints, the intensity and relative position of each
DNA band/peak for each sample are digitally analyzed using
an adequate software. Rank similarity matrices are computed
for each community and used to construct “maps”
highlighting the similarity/dissimilarity of genetic structures
among samples (Kruskal and Wish 1978). Two- or threedimensional maps can be chosen so that the stress factor
(i.e., distortion factor between actual similarity rankings and
the corresponding distance rankings in the map) is sufficiently
low. Then, analysis of similarities (ANOSIM) can be
performed to test for possible treatment effects on the structure of each bacterial community, one-way ANOSIM being
performed to compare the genetic structures of samples pairs.
ANOSIM results in the computation of p values (level of
significance) and R statistics values (degree of discrimination
between treatments: values around 0–1 for no discrimination
and perfect discrimination, respectively). This approach
was used to analyze RISA profiles, T-RFLP profiles, and
DGGE fingerprints targeting four different communities
for grassland soils by Patra and collaborators (2006).
Comparison of Community Diversity and Composition
Between Samples Based on Sequence Banks
Methods like cloning/sequencing or pyrosequencing provide
a list of sequences for each sample, which can be used to
characterize the community diversity and composition (e.g.,
richness, evenness, major versus minor taxa). Typically,
three steps of data analysis are used:
(i) Chimeras: The use of PCR on DNAs extracted from
complex environments can cause the formation of
chimeras, or hybrid DNA sequences where one fragment
is used as primer on a different sequence. The program
CHECK_CHIMERA of the “Ribosomal Database Project” (RDP) detects this kind of event by phylogenetic
analysis of sequences by sliding window. If a chimera
has been formed, the two ends of an amplicon will have
different nearest phyletic neighbors. This type of event
can of course occur naturally due to conjugation events
followed by recombination, though very rarely.
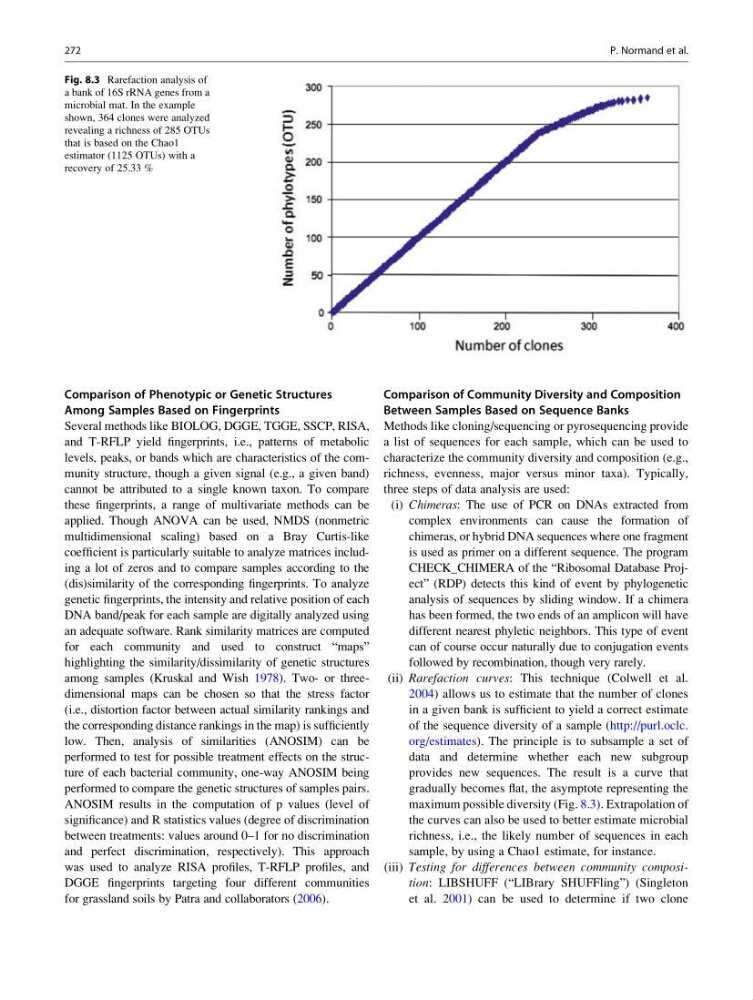
(ii) Rarefaction curves: This technique (Colwell et al.
2004) allows us to estimate that the number of clones
in a given bank is sufficient to yield a correct estimate
of the sequence diversity of a sample (http://purl.oclc.
org/estimates). The principle is to subsample a set of
data and determine whether each new subgroup
provides new sequences. The result is a curve that
gradually becomes flat, the asymptote representing the
maximum possible diversity (Fig. 8.3). Extrapolation of
the curves can also be used to better estimate microbial
richness, i.e., the likely number of sequences in each
sample, by using a Chao1 estimate, for instance.
(iii) Testing for differences between community composition: LIBSHUFF (“LIBrary SHUFFling”) (Singleton
et al. 2001) can be used to determine if two clone
Fig. 8.3 Rarefaction analysis of
a bank of 16S rRNA genes from a
microbial mat. In the example
shown, 364 clones were analyzed
revealing a richness of 285 OTUs
that is based on the Chao1
estimator (1125 OTUs) with a
recovery of 25.33 %
272
P. Normand et al.
Among Samples Based on Fingerprints
Several methods like BIOLOG, DGGE, TGGE, SSCP, RISA,
and T-RFLP yield fingerprints, i.e., patterns of metabolic
levels, peaks, or bands which are characteristics of the community structure, though a given signal (e.g., a given band)
cannot be attributed to a single known taxon. To compare
these fingerprints, a range of multivariate methods can be
applied. Though ANOVA can be used, NMDS (nonmetric
multidimensional scaling) based on a Bray Curtis-like
coefficient is particularly suitable to analyze matrices including a lot of zeros and to compare samples according to the
(dis)similarity of the corresponding fingerprints. To analyze
genetic fingerprints, the intensity and relative position of each
DNA band/peak for each sample are digitally analyzed using
an adequate software. Rank similarity matrices are computed
for each community and used to construct “maps”
highlighting the similarity/dissimilarity of genetic structures
among samples (Kruskal and Wish 1978). Two- or threedimensional maps can be chosen so that the stress factor
(i.e., distortion factor between actual similarity rankings and
the corresponding distance rankings in the map) is sufficiently
low. Then, analysis of similarities (ANOSIM) can be
performed to test for possible treatment effects on the structure of each bacterial community, one-way ANOSIM being
performed to compare the genetic structures of samples pairs.
ANOSIM results in the computation of p values (level of
significance) and R statistics values (degree of discrimination
between treatments: values around 0–1 for no discrimination
and perfect discrimination, respectively). This approach
was used to analyze RISA profiles, T-RFLP profiles, and
DGGE fingerprints targeting four different communities
for grassland soils by Patra and collaborators (2006).
Comparison of Community Diversity and Composition
Between Samples Based on Sequence Banks
Methods like cloning/sequencing or pyrosequencing provide
a list of sequences for each sample, which can be used to
characterize the community diversity and composition (e.g.,
richness, evenness, major versus minor taxa). Typically,
three steps of data analysis are used:
(i) Chimeras: The use of PCR on DNAs extracted from
complex environments can cause the formation of
chimeras, or hybrid DNA sequences where one fragment
is used as primer on a different sequence. The program
CHECK_CHIMERA of the “Ribosomal Database Project” (RDP) detects this kind of event by phylogenetic
analysis of sequences by sliding window. If a chimera
has been formed, the two ends of an amplicon will have
different nearest phyletic neighbors. This type of event
can of course occur naturally due to conjugation events
followed by recombination, though very rarely.
(ii) Rarefaction curves: This technique (Colwell et al.
2004) allows us to estimate that the number of clones
in a given bank is sufficient to yield a correct estimate
of the sequence diversity of a sample (http://purl.oclc.
org/estimates). The principle is to subsample a set of
data and determine whether each new subgroup
provides new sequences. The result is a curve that
gradually becomes flat, the asymptote representing the
maximum possible diversity (Fig. 8.3). Extrapolation of
the curves can also be used to better estimate microbial
richness, i.e., the likely number of sequences in each
sample, by using a Chao1 estimate, for instance.
(iii) Testing for differences between community composition: LIBSHUFF (“LIBrary SHUFFling”) (Singleton
et al. 2001) can be used to determine if two clone
Fig. 8.3 Rarefaction analysis of
a bank of 16S rRNA genes from a
microbial mat. In the example
shown, 364 clones were analyzed
revealing a richness of 285 OTUs
that is based on the Chao1
estimator (1125 OTUs) with a
recovery of 25.33 %
272
P. Normand et al.