

Cloning/Sequencing to Analyze the Diversity of
Ribosomal Genes or That of Their Complementary
DNA (cDNA)
After PCR (or RT-PCR), amplified fragments are cloned in
E. coli using a TA plasmid (to accommodate the A base
added by Taq polymerases at the 3
0 end of the amplified
fragment). The clones are grouped according to their RFLP
pattern (restriction fragment length polymorphism), and
the fragments are then sequenced. This approach provides
a molecular inventory of microbial populations. It was used
in particular to characterize the composition of bacterial
communities of sediments contaminated by hydrocarbons
(Bordenave et al. 2007) and extreme environments such as
acid mine drainage (Bruneel et al. 2006). Banks are
analyzed and compared by statistical tools as LIBSHUFF,
and saturation curves are used to assess the depth of diversity assessment (see below). A Web of Science search with
cloning/sequencing as keyword done in December 2012
permitted to retrieve 4,728 references. However, the use
of this method slightly decreased during the 1996–2012
period (Fig. 8.1).
8.4.2.2 Data Analysis for Comparison of
Community Structure and Diversity
Between Samples
Whatever the method used and the targeted level (i.e., metabolic diversity, genetic diversity of phylogenetic or functional markers, using DNA or RNA), adequate approaches
and statistical tests must be used to compare diversity or
community structure between samples (Box 8.2).
Box 8.2: Testing Hypotheses About Biodiversity
Cindy Morris
Objective: Determine the impact of a genetically
modified bacterium improving plant growth (PGPR)
on the community of bacteria associated with plant
roots.
Hypothesis: A genetically modified strain of PGPR
Pseudomonas fluorescens introduced by seed coating
has a significant effect on the structure (i.e., the richness) of the bacterial community associated with
cucumber roots compared to the wild strain (Mahaffee
and Kloepper 1997).
Testing the hypothesis: The diversity of culturable
bacteria in the rhizosphere and roots was quantified by
two indices – richness (total number of bacterial
genera) and the Hill N 1 and N 2 indices:
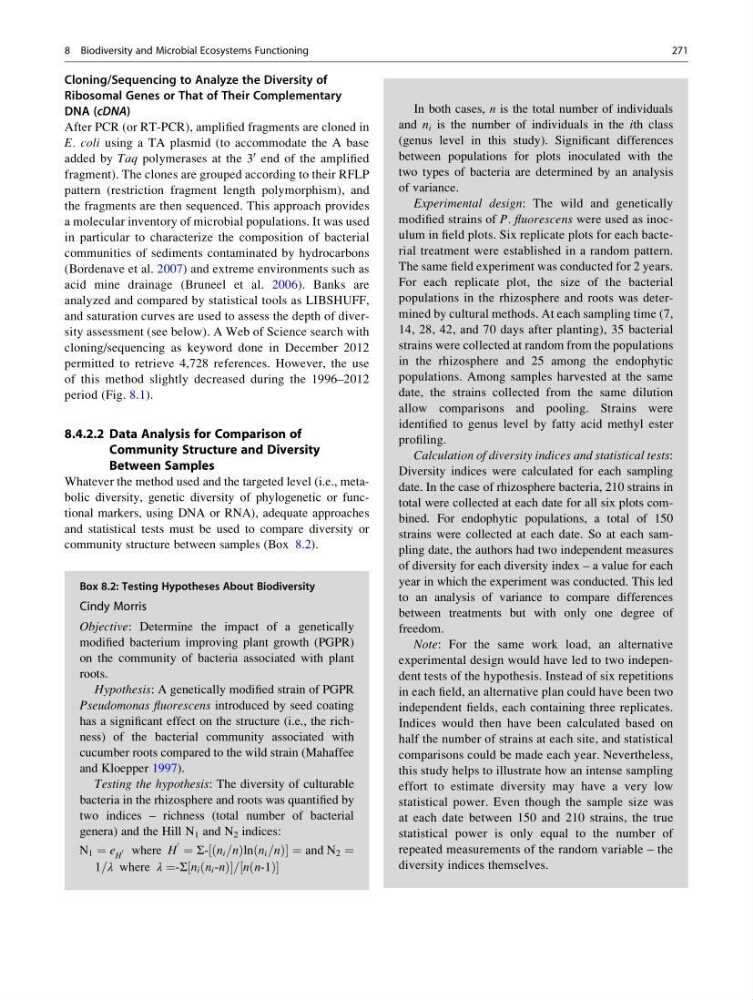
N 1 ¼ e H
0 where H
0 ¼ Σ- n i =n
ð
Þln n i =n
ð
Þ
½
¼ and N 2 ¼
1=λ where λ ¼-Σ n i n i
ð
½
-nÞ= n n
ð
½ -1Þ
(continued)
Box 8.2 (continued)
In both cases, n is the total number of individuals
and n i is the number of individuals in the ith class
(genus level in this study). Significant differences
between populations for plots inoculated with the
two types of bacteria are determined by an analysis
of variance.
Experimental design: The wild and genetically
modified strains of P. fluorescens were used as inoculum in field plots. Six replicate plots for each bacterial treatment were established in a random pattern.
The same field experiment was conducted for 2 years.
For each replicate plot, the size of the bacterial
populations in the rhizosphere and roots was determined by cultural methods. At each sampling time (7,
14, 28, 42, and 70 days after planting), 35 bacterial
strains were collected at random from the populations
in the rhizosphere and 25 among the endophytic
populations. Among samples harvested at the same
date, the strains collected from the same dilution
allow comparisons and pooling. Strains were
identified to genus level by fatty acid methyl ester
profiling.
Calculation of diversity indices and statistical tests:
Diversity indices were calculated for each sampling
date. In the case of rhizosphere bacteria, 210 strains in
total were collected at each date for all six plots combined. For endophytic populations, a total of 150
strains were collected at each date. So at each sampling date, the authors had two independent measures
of diversity for each diversity index – a value for each
year in which the experiment was conducted. This led
to an analysis of variance to compare differences
between treatments but with only one degree of
freedom.
Note: For the same work load, an alternative
experimental design would have led to two independent tests of the hypothesis. Instead of six repetitions
in each field, an alternative plan could have been two
independent fields, each containing three replicates.
Indices would then have been calculated based on
half the number of strains at each site, and statistical
comparisons could be made each year. Nevertheless,
this study helps to illustrate how an intense sampling
effort to estimate diversity may have a very low
statistical power. Even though the sample size was
at each date between 150 and 210 strains, the true
statistical power is only equal to the number of
repeated measurements of the random variable – the
diversity indices themselves.
8 Biodiversity and Microbial Ecosystems Functioning
271
Ribosomal Genes or That of Their Complementary
DNA (cDNA)
After PCR (or RT-PCR), amplified fragments are cloned in
E. coli using a TA plasmid (to accommodate the A base
added by Taq polymerases at the 3
0 end of the amplified
fragment). The clones are grouped according to their RFLP
pattern (restriction fragment length polymorphism), and
the fragments are then sequenced. This approach provides
a molecular inventory of microbial populations. It was used
in particular to characterize the composition of bacterial
communities of sediments contaminated by hydrocarbons
(Bordenave et al. 2007) and extreme environments such as
acid mine drainage (Bruneel et al. 2006). Banks are
analyzed and compared by statistical tools as LIBSHUFF,
and saturation curves are used to assess the depth of diversity assessment (see below). A Web of Science search with
cloning/sequencing as keyword done in December 2012
permitted to retrieve 4,728 references. However, the use
of this method slightly decreased during the 1996–2012
period (Fig. 8.1).
8.4.2.2 Data Analysis for Comparison of
Community Structure and Diversity
Between Samples
Whatever the method used and the targeted level (i.e., metabolic diversity, genetic diversity of phylogenetic or functional markers, using DNA or RNA), adequate approaches
and statistical tests must be used to compare diversity or
community structure between samples (Box 8.2).
Box 8.2: Testing Hypotheses About Biodiversity
Cindy Morris
Objective: Determine the impact of a genetically
modified bacterium improving plant growth (PGPR)
on the community of bacteria associated with plant
roots.
Hypothesis: A genetically modified strain of PGPR
Pseudomonas fluorescens introduced by seed coating
has a significant effect on the structure (i.e., the richness) of the bacterial community associated with
cucumber roots compared to the wild strain (Mahaffee
and Kloepper 1997).
Testing the hypothesis: The diversity of culturable
bacteria in the rhizosphere and roots was quantified by
two indices – richness (total number of bacterial
genera) and the Hill N 1 and N 2 indices:
N 1 ¼ e H
0 where H
0 ¼ Σ- n i =n
ð
Þln n i =n
ð
Þ
½
¼ and N 2 ¼
1=λ where λ ¼-Σ n i n i
ð
½
-nÞ= n n
ð
½ -1Þ
(continued)
Box 8.2 (continued)
In both cases, n is the total number of individuals
and n i is the number of individuals in the ith class
(genus level in this study). Significant differences
between populations for plots inoculated with the
two types of bacteria are determined by an analysis
of variance.
Experimental design: The wild and genetically
modified strains of P. fluorescens were used as inoculum in field plots. Six replicate plots for each bacterial treatment were established in a random pattern.
The same field experiment was conducted for 2 years.
For each replicate plot, the size of the bacterial
populations in the rhizosphere and roots was determined by cultural methods. At each sampling time (7,
14, 28, 42, and 70 days after planting), 35 bacterial
strains were collected at random from the populations
in the rhizosphere and 25 among the endophytic
populations. Among samples harvested at the same
date, the strains collected from the same dilution
allow comparisons and pooling. Strains were
identified to genus level by fatty acid methyl ester
profiling.
Calculation of diversity indices and statistical tests:
Diversity indices were calculated for each sampling
date. In the case of rhizosphere bacteria, 210 strains in
total were collected at each date for all six plots combined. For endophytic populations, a total of 150
strains were collected at each date. So at each sampling date, the authors had two independent measures
of diversity for each diversity index – a value for each
year in which the experiment was conducted. This led
to an analysis of variance to compare differences
between treatments but with only one degree of
freedom.
Note: For the same work load, an alternative
experimental design would have led to two independent tests of the hypothesis. Instead of six repetitions
in each field, an alternative plan could have been two
independent fields, each containing three replicates.
Indices would then have been calculated based on
half the number of strains at each site, and statistical
comparisons could be made each year. Nevertheless,
this study helps to illustrate how an intense sampling
effort to estimate diversity may have a very low
statistical power. Even though the sample size was
at each date between 150 and 210 strains, the true
statistical power is only equal to the number of
repeated measurements of the random variable – the
diversity indices themselves.
8 Biodiversity and Microbial Ecosystems Functioning
271