

Box 7.1 (continued)
prompting further inventory efforts in order to
improve databases (for protists, see Pawlowski et al.
2012). Indeed, unexpected high levels of 18S rDNA
sequence richness have been reported for diverse taxonomic groups targeted with specific PCR primers.
For Diplonemids (Euglenozoa) (Lara et al. 2009) and
Centroheliozoa (Cavalier-Smith and von der Heyden
2007), the number of phylotypes sequenced even
exceeded the number of described species. For deepsea Foraminifera, most of high-throughput sequencing
reads corresponded to inconspicuous, poorlydescribed lineages (Lecroq et al. 2011).
These observations are not limited to “exotic”
environments. Highly diverse and numerous, unknown
(continued)
Box 7.1 (continued)
taxa also live at our doorstep. For example, 83 Operational Taxonomic Units (OTUs) were delineated from
only 377 sequences generated from a pond near Paris
(France) and most could not be assigned to a known
species, including the well-studied ciliates (S ˇ lapeta et al.
2005b). Obviously, even among extensively studied
taxa exist numerous genuine species that are difficult to
observe (small sized, strict intracellular parasites, etc.) or
that still need to be sequenced and deposed into databases.
However, although the diversity stemming from morphologically similar but genetically distinct, cryptic species
could be sequenced, metagenetic estimates are subject to
multiple biases, especially at the sequencing scale
provided by high-throughput sequencing technologies.
(continued)
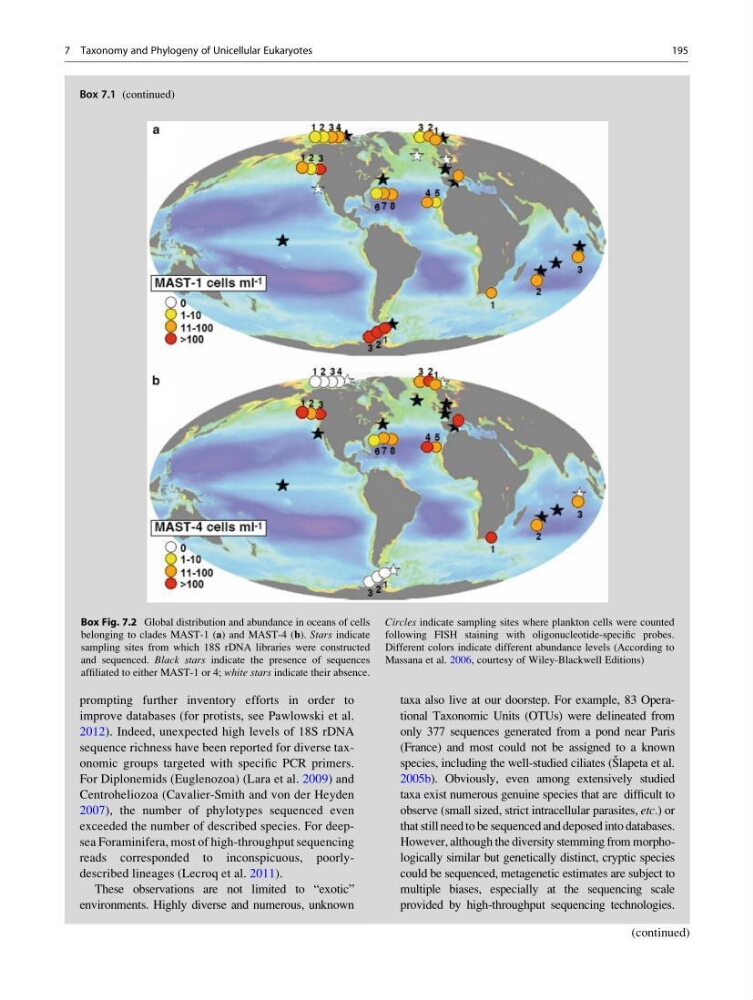
Box Fig. 7.2 Global distribution and abundance in oceans of cells
belonging to clades MAST-1 (a) and MAST-4 (b). Stars indicate
sampling sites from which 18S rDNA libraries were constructed
and sequenced. Black stars indicate the presence of sequences
affiliated to either MAST-1 or 4; white stars indicate their absence.
Circles indicate sampling sites where plankton cells were counted
following FISH staining with oligonucleotide-specific probes.
Different colors indicate different abundance levels (According to
Massana et al. 2006, courtesy of Wiley-Blackwell Editions)
7 Taxonomy and Phylogeny of Unicellular Eukaryotes
195
prompting further inventory efforts in order to
improve databases (for protists, see Pawlowski et al.
2012). Indeed, unexpected high levels of 18S rDNA
sequence richness have been reported for diverse taxonomic groups targeted with specific PCR primers.
For Diplonemids (Euglenozoa) (Lara et al. 2009) and
Centroheliozoa (Cavalier-Smith and von der Heyden
2007), the number of phylotypes sequenced even
exceeded the number of described species. For deepsea Foraminifera, most of high-throughput sequencing
reads corresponded to inconspicuous, poorlydescribed lineages (Lecroq et al. 2011).
These observations are not limited to “exotic”
environments. Highly diverse and numerous, unknown
(continued)
Box 7.1 (continued)
taxa also live at our doorstep. For example, 83 Operational Taxonomic Units (OTUs) were delineated from
only 377 sequences generated from a pond near Paris
(France) and most could not be assigned to a known
species, including the well-studied ciliates (S ˇ lapeta et al.
2005b). Obviously, even among extensively studied
taxa exist numerous genuine species that are difficult to
observe (small sized, strict intracellular parasites, etc.) or
that still need to be sequenced and deposed into databases.
However, although the diversity stemming from morphologically similar but genetically distinct, cryptic species
could be sequenced, metagenetic estimates are subject to
multiple biases, especially at the sequencing scale
provided by high-throughput sequencing technologies.
(continued)
Box Fig. 7.2 Global distribution and abundance in oceans of cells
belonging to clades MAST-1 (a) and MAST-4 (b). Stars indicate
sampling sites from which 18S rDNA libraries were constructed
and sequenced. Black stars indicate the presence of sequences
affiliated to either MAST-1 or 4; white stars indicate their absence.
Circles indicate sampling sites where plankton cells were counted
following FISH staining with oligonucleotide-specific probes.
Different colors indicate different abundance levels (According to
Massana et al. 2006, courtesy of Wiley-Blackwell Editions)
7 Taxonomy and Phylogeny of Unicellular Eukaryotes
195