

challenging tasks which were performed at Biosphere 2 in
Arizona (Hearn, 2001b), Kaneohe in Hawaii and the Gulf
of Aqaba in the Red Sea (Reidenbach et al., 2006). These
measurements generally support the local balance of production and dissipation; the values for dissipation are based
on the spectral use of the “inertial subrange” for turbulence
(Hearn, 2010).
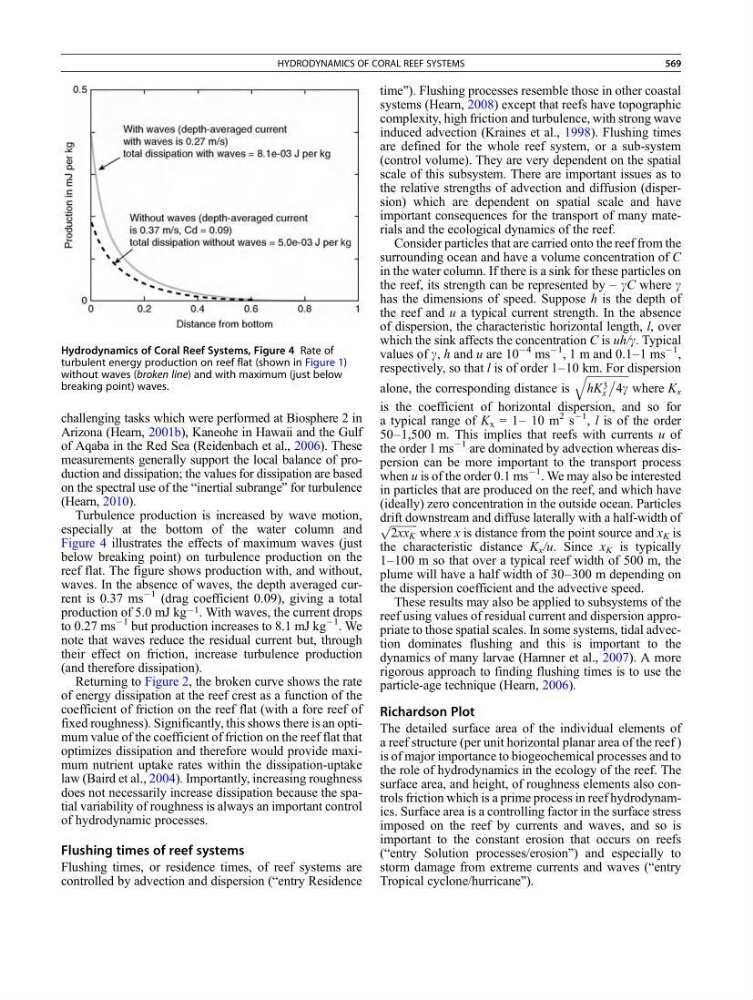
Turbulence production is increased by wave motion,
especially at the bottom of the water column and
Figure 4 illustrates the effects of maximum waves (just
below breaking point) on turbulence production on the
reef flat. The figure shows production with, and without,
waves. In the absence of waves, the depth averaged current is 0.37 ms
À1 (drag coefficient 0.09), giving a total
production of 5.0 mJ kg À1 . With waves, the current drops
to 0.27 ms
À1 but production increases to 8.1 mJ kg
À1
. We
note that waves reduce the residual current but, through
their effect on friction, increase turbulence production
(and therefore dissipation).
Returning to Figure 2, the broken curve shows the rate
of energy dissipation at the reef crest as a function of the
coefficient of friction on the reef flat (with a fore reef of
fixed roughness). Significantly, this shows there is an optimum value of the coefficient of friction on the reef flat that
optimizes dissipation and therefore would provide maximum nutrient uptake rates within the dissipation-uptake
law (Baird et al., 2004). Importantly, increasing roughness
does not necessarily increase dissipation because the spatial variability of roughness is always an important control
of hydrodynamic processes.
Flushing times of reef systems
Flushing times, or residence times, of reef systems are
controlled by advection and dispersion (“entry Residence
time”). Flushing processes resemble those in other coastal
systems (Hearn, 2008) except that reefs have topographic
complexity, high friction and turbulence, with strong wave
induced advection (Kraines et al., 1998). Flushing times
are defined for the whole reef system, or a sub-system
(control volume). They are very dependent on the spatial
scale of this subsystem. There are important issues as to
the relative strengths of advection and diffusion (dispersion) which are dependent on spatial scale and have
important consequences for the transport of many materials and the ecological dynamics of the reef.
Consider particles that are carried onto the reef from the
surrounding ocean and have a volume concentration of C
in the water column. If there is a sink for these particles on
the reef, its strength can be represented by – gC where g
has the dimensions of speed. Suppose h is the depth of
the reef and u a typical current strength. In the absence
of dispersion, the characteristic horizontal length, l, over
which the sink affects the concentration C is uh/g. Typical
values of g, h and u are 10
À4 ms
À1
, 1 m and 0.1–1 ms
À1
,
respectively, so that l is of order 1–10 km. For dispersion
alone, the corresponding distance is
ffiffiffiffiffiffiffiffiffiffiffiffiffiffiffi ffi
hK 3
x
4g
q
where K x
is the coefficient of horizontal dispersion, and so for
a typical range of K x = 1– 10 m
2 s
À1
, l is of the order
50–1,500 m. This implies that reefs with currents u of
the order 1 ms
À1 are dominated by advection whereas dispersion can be more important to the transport process
when u is of the order 0.1 ms
À1 . We may also be interested
in particles that are produced on the reef, and which have
(ideally) zero concentration in the outside ocean. Particles
drift downstream and diffuse laterally with a half-width of
ffiffiffiffiffiffiffiffiffi ffi
2xx K
p
where x is distance from the point source and x K is
the characteristic distance K x /u. Since x K is typically
1–100 m so that over a typical reef width of 500 m, the
plume will have a half width of 30–300 m depending on
the dispersion coefficient and the advective speed.
These results may also be applied to subsystems of the
reef using values of residual current and dispersion appropriate to those spatial scales. In some systems, tidal advection dominates flushing and this is important to the
dynamics of many larvae (Hamner et al., 2007). A more
rigorous approach to finding flushing times is to use the
particle-age technique (Hearn, 2006).
Richardson Plot
The detailed surface area of the individual elements of
a reef structure (per unit horizontal planar area of the reef )
is of major importance to biogeochemical processes and to
the role of hydrodynamics in the ecology of the reef. The
surface area, and height, of roughness elements also controls friction which is a prime process in reef hydrodynamics. Surface area is a controlling factor in the surface stress
imposed on the reef by currents and waves, and so is
important to the constant erosion that occurs on reefs
(“entry Solution processes/erosion”) and especially to
storm damage from extreme currents and waves (“entry
Tropical cyclone/hurricane”).
Hydrodynamics of Coral Reef Systems, Figure 4 Rate of
turbulent energy production on reef flat (shown in Figure 1)
without waves (broken line) and with maximum (just below
breaking point) waves.
HYDRODYNAMICS OF CORAL REEF SYSTEMS
569