

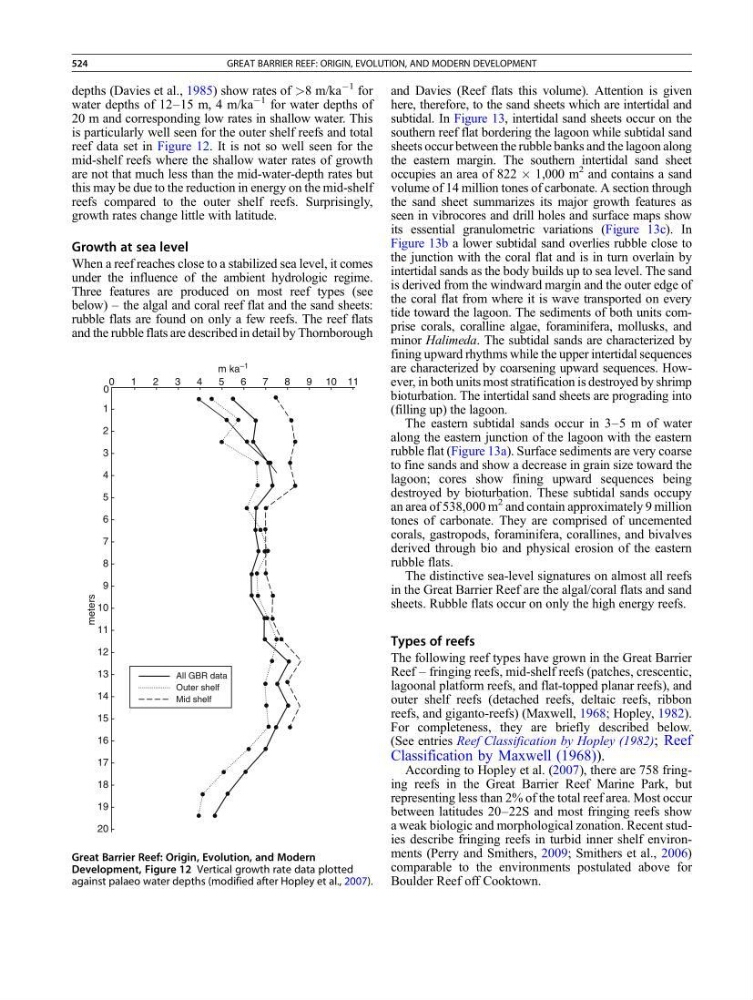
depths (Davies et al., 1985) show rates of >8 m/ka
À1 for
water depths of 12–15 m, 4 m/ka
À1 for water depths of
20 m and corresponding low rates in shallow water. This
is particularly well seen for the outer shelf reefs and total
reef data set in Figure 12. It is not so well seen for the
mid-shelf reefs where the shallow water rates of growth
are not that much less than the mid-water-depth rates but
this may be due to the reduction in energy on the mid-shelf
reefs compared to the outer shelf reefs. Surprisingly,
growth rates change little with latitude.
Growth at sea level
When a reef reaches close to a stabilized sea level, it comes
under the influence of the ambient hydrologic regime.
Three features are produced on most reef types (see
below) – the algal and coral reef flat and the sand sheets:
rubble flats are found on only a few reefs. The reef flats
and the rubble flats are described in detail by Thornborough
and Davies (Reef flats this volume). Attention is given
here, therefore, to the sand sheets which are intertidal and
subtidal. In Figure 13, intertidal sand sheets occur on the
southern reef flat bordering the lagoon while subtidal sand
sheets occur between the rubble banks and the lagoon along
the eastern margin. The southern intertidal sand sheet
occupies an area of 822 Â 1,000 m
2 and contains a sand
volume of 14 million tones of carbonate. A section through
the sand sheet summarizes its major growth features as
seen in vibrocores and drill holes and surface maps show
its essential granulometric variations (Figure 13c). In
Figure 13b a lower subtidal sand overlies rubble close to
the junction with the coral flat and is in turn overlain by
intertidal sands as the body builds up to sea level. The sand
is derived from the windward margin and the outer edge of
the coral flat from where it is wave transported on every
tide toward the lagoon. The sediments of both units comprise corals, coralline algae, foraminifera, mollusks, and
minor Halimeda. The subtidal sands are characterized by
fining upward rhythms while the upper intertidal sequences
are characterized by coarsening upward sequences. However, in both units most stratification is destroyed by shrimp
bioturbation. The intertidal sand sheets are prograding into
(filling up) the lagoon.
The eastern subtidal sands occur in 3–5 m of water
along the eastern junction of the lagoon with the eastern
rubble flat (Figure 13a). Surface sediments are very coarse
to fine sands and show a decrease in grain size toward the
lagoon; cores show fining upward sequences being
destroyed by bioturbation. These subtidal sands occupy
an area of 538,000 m
2 and contain approximately 9 million
tones of carbonate. They are comprised of uncemented
corals, gastropods, foraminifera, corallines, and bivalves
derived through bio and physical erosion of the eastern
rubble flats.
The distinctive sea-level signatures on almost all reefs
in the Great Barrier Reef are the algal/coral flats and sand
sheets. Rubble flats occur on only the high energy reefs.
Types of reefs
The following reef types have grown in the Great Barrier
Reef – fringing reefs, mid-shelf reefs (patches, crescentic,
lagoonal platform reefs, and flat-topped planar reefs), and
outer shelf reefs (detached reefs, deltaic reefs, ribbon
reefs, and giganto-reefs) (Maxwell, 1968; Hopley, 1982).
For completeness, they are briefly described below.
(See entries Reef Classification by Hopley (1982); Reef
Classification by Maxwell (1968)).
According to Hopley et al. (2007), there are 758 fringing reefs in the Great Barrier Reef Marine Park, but
representing less than 2% of the total reef area. Most occur
between latitudes 20–22S and most fringing reefs show
a weak biologic and morphological zonation. Recent studies describe fringing reefs in turbid inner shelf environments (Perry and Smithers, 2009; Smithers et al., 2006)
comparable to the environments postulated above for
Boulder Reef off Cooktown.
All GBR data
Outer shelf
Mid shelf
0
1
2
3
4
5
6
7
8
9
10
11
12
13
14
15
16
18
19
20
17
0
1
2
4
5
6
7
8
9 10 11
3
m ka –1
meters
Great Barrier Reef: Origin, Evolution, and Modern
Development, Figure 12 Vertical growth rate data plotted
against palaeo water depths (modified after Hopley et al., 2007).
524
GREAT BARRIER REEF: ORIGIN, EVOLUTION, AND MODERN DEVELOPMENT