

the pre-mid Holocene rise in sea level increasingly lags
the globally averaged sea-level rise; and
the Last Glacial Maximum sea levels increase in depth.
Across the Great Barrier Reef, adjacent islands and continental shoreline, the observational evidence generally
confirms these trends although it has not always been
interpreted in terms of the differential isostatic response.
For example, the observation of a progressive decrease
with distance from the shore of the oldest coral ages
found at the upper limits of growth, has sometimes been
interpreted as a result of outer reefs being less capable of
keeping up with sea-level rise than inner reefs.
The amplitudes of the highstand and the lags in the
response are dependent on the rheological parameters
describing the earth’s mantle and lithosphere so that the
matching of observations and predictions enables these
parameters to be estimated for the region of analysis.
Glacio-hydro-isostatic studies of the formerly glaciated
(near-field) regions likewise provide information on the
earth’s response function as well as on the dimensions
and timing of the former ice sheets, particularly during
their final decay phase. By an iterative process between
far- and near-field regions, it becomes possible to separate
the earth- and ice-model parameters that quantify the
rebound formulation and thus to develop a predictive
global model for that part of sea-level change associated
with the glacial cycles. These models are best developed
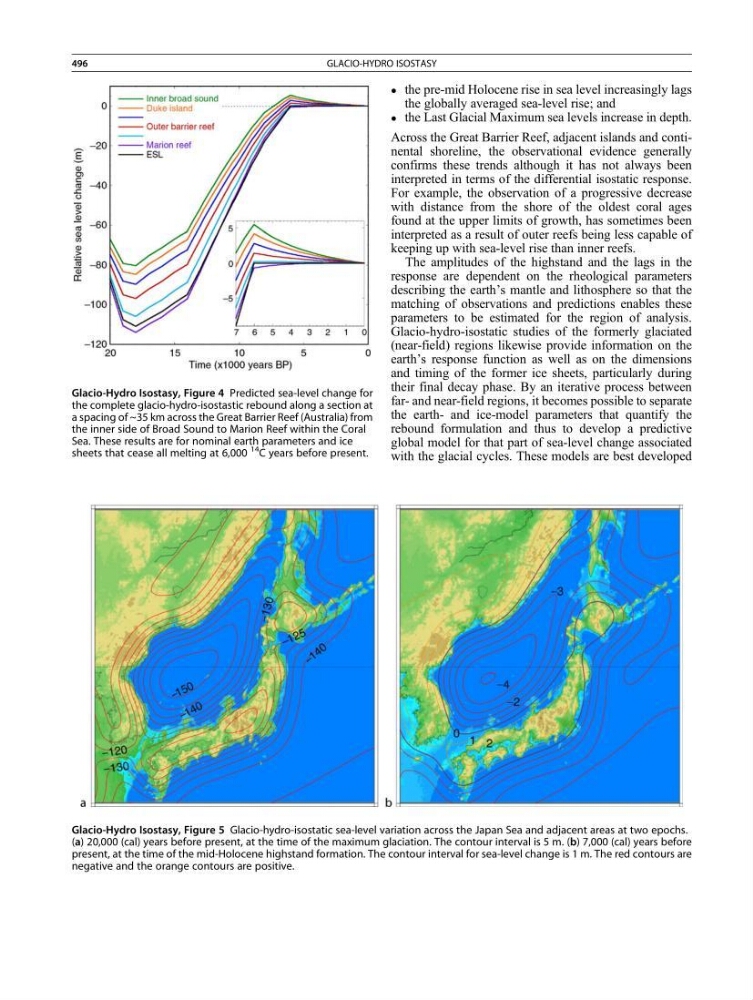
Glacio-Hydro Isostasy, Figure 4 Predicted sea-level change for
the complete glacio-hydro-isostastic rebound along a section at
a spacing of ~35 km across the Great Barrier Reef (Australia) from
the inner side of Broad Sound to Marion Reef within the Coral
Sea. These results are for nominal earth parameters and ice
sheets that cease all melting at 6,000
14 C years before present.
Glacio-Hydro Isostasy, Figure 5 Glacio-hydro-isostatic sea-level variation across the Japan Sea and adjacent areas at two epochs.
(a) 20,000 (cal) years before present, at the time of the maximum glaciation. The contour interval is 5 m. (b) 7,000 (cal) years before
present, at the time of the mid-Holocene highstand formation. The contour interval for sea-level change is 1 m. The red contours are
negative and the orange contours are positive.
496
GLACIO-HYDRO ISOSTASY
the globally averaged sea-level rise; and
the Last Glacial Maximum sea levels increase in depth.
Across the Great Barrier Reef, adjacent islands and continental shoreline, the observational evidence generally
confirms these trends although it has not always been
interpreted in terms of the differential isostatic response.
For example, the observation of a progressive decrease
with distance from the shore of the oldest coral ages
found at the upper limits of growth, has sometimes been
interpreted as a result of outer reefs being less capable of
keeping up with sea-level rise than inner reefs.
The amplitudes of the highstand and the lags in the
response are dependent on the rheological parameters
describing the earth’s mantle and lithosphere so that the
matching of observations and predictions enables these
parameters to be estimated for the region of analysis.
Glacio-hydro-isostatic studies of the formerly glaciated
(near-field) regions likewise provide information on the
earth’s response function as well as on the dimensions
and timing of the former ice sheets, particularly during
their final decay phase. By an iterative process between
far- and near-field regions, it becomes possible to separate
the earth- and ice-model parameters that quantify the
rebound formulation and thus to develop a predictive
global model for that part of sea-level change associated
with the glacial cycles. These models are best developed
Glacio-Hydro Isostasy, Figure 4 Predicted sea-level change for
the complete glacio-hydro-isostastic rebound along a section at
a spacing of ~35 km across the Great Barrier Reef (Australia) from
the inner side of Broad Sound to Marion Reef within the Coral
Sea. These results are for nominal earth parameters and ice
sheets that cease all melting at 6,000
14 C years before present.
Glacio-Hydro Isostasy, Figure 5 Glacio-hydro-isostatic sea-level variation across the Japan Sea and adjacent areas at two epochs.
(a) 20,000 (cal) years before present, at the time of the maximum glaciation. The contour interval is 5 m. (b) 7,000 (cal) years before
present, at the time of the mid-Holocene highstand formation. The contour interval for sea-level change is 1 m. The red contours are
negative and the orange contours are positive.
496
GLACIO-HYDRO ISOSTASY