

significant merit but provides a different suite of data to census-based studies and does not enable the relative importance of different producer/eroder groups to be quantified.
Variations in carbonate production at the reef
system scale
One important aspect of considering reef carbonate production from a carbonate budget perspective is the ability
to quantify inter-reef variations in styles of reef framework
accumulation. Kleypas et al., (2001), for example,
highlighted a range of conceptual reef states that directly
relate to variations in relative rates of carbonate production,
sediment import and export and framework erosion. These
different states demonstrate how shifts in the relative importance of individual processes, associated with different
types of reef-building environments or environmental conditions, can result in fundamentally different reef budgetary
states and reef framework structures. Production-dominated
reefs, for example, exhibit rates of in situ biological CaCO 3
production far in excess of rates of carbonate degradation
and thus the budget is positive. This state is consistent with
the rapid vertical growth trajectories exhibited by “keep-up”
or “catch-up” reefs during the Holocene sea-level rise. In
contrast, import-dominated reefs contain a high proportion
of sedimentary material that is often terrigenous in origin.
These reefs also have positive budgets, and good examples
include the reefs described from the inner-shelf areas of the
Great Barrier Reef in Australia (Smithers and Larcombe,
2003), Thailand (Tudhope and Scoffin, 1994) and Mozambique (Perry, 2005). Bioerosion-dominated reefs exhibit
negative budgets with primary and secondary carbonate
production being exceeded by biological substrate degradation. Examples include areas of high carbonate turnover,
such as the non-framebuilding coral communities described
from Oman (Benzoni et al., 2003) and the Red Sea (Riegl
and Piller, 2000). Similar erosion-dominated states may
also arise where non-calcifying groups become dominant
and rates of carbonate production are reduced. A good
example of this has been described from the reefs around
Uva Island, offshore Panama (Eakin, 2001).
Carbonate budgets and long-term rates of reef
framework accumulation
The conceptual budgetary states discussed above provide
a framework for understanding the influence of carbonate
production and erosion processes on reef accretion potential
and framework fabric development at the system scale. In
reality, however, framework types and their production
rates are likely to vary markedly within different reef
sub-environments (reef crest, shallow reef front, reef slope,
etc.) depending upon the composition and abundance of
coral species, species growth rates and, variations in the
types and rates at which different productional and erosional processes operate. Perry (1999) illustrated spatial
variations in the relative importance of these various processes and the resultant framework fabrics across
a fringing reef system in north Jamaica, and these intrareefal variations are also evident in budget assessments
conducted in different areas of individual reef systems
(Eakin, 1996). Over longer (millennial) timescales, these
variations aggregate to determine net framework accumulation rates that are evident in many reef core records. Data
available from many reefs on Australia’s Great Barrier Reef
demonstrate a relatively consistent relationship between
facies type and net long-term accretion rates; highest rates
(> 8 m ka
À1
) occurring in branched coral facies, intermediate rates (typically < 5 m ka
À1
) occurring in head coral
facies, and the slowest rates (< 2 m ka
À1
) occurring within
algal crust facies (Hopley et al., 2007). These datasets also
demonstrate marked changes in framework accretion rates
during different phases of reef growth, with slow net accretion immediately following initiation, highest rates occurring as reefs accreted under rapidly rising sea levels, and
slow or suppressed rates as reefs reach sea level. These variations reflect the carbonate production states and processes
associated with different phases of reef development and
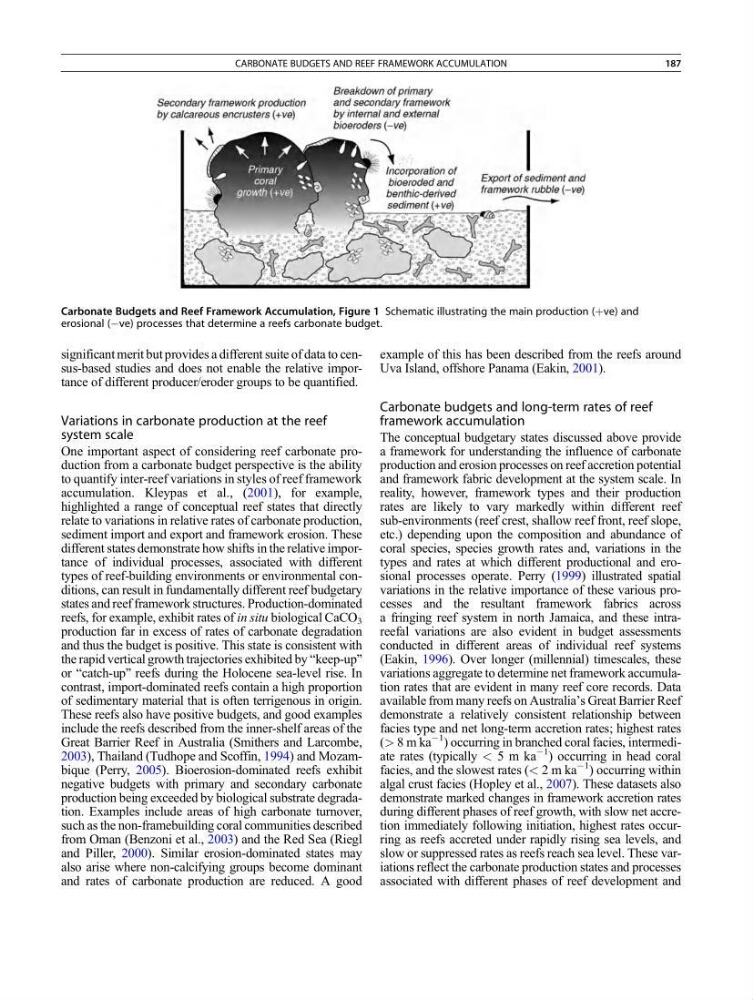
Carbonate Budgets and Reef Framework Accumulation, Figure 1 Schematic illustrating the main production (þve) and
erosional (Àve) processes that determine a reefs carbonate budget.
CARBONATE BUDGETS AND REEF FRAMEWORK ACCUMULATION
187
Variations in carbonate production at the reef
system scale
One important aspect of considering reef carbonate production from a carbonate budget perspective is the ability
to quantify inter-reef variations in styles of reef framework
accumulation. Kleypas et al., (2001), for example,
highlighted a range of conceptual reef states that directly
relate to variations in relative rates of carbonate production,
sediment import and export and framework erosion. These
different states demonstrate how shifts in the relative importance of individual processes, associated with different
types of reef-building environments or environmental conditions, can result in fundamentally different reef budgetary
states and reef framework structures. Production-dominated
reefs, for example, exhibit rates of in situ biological CaCO 3
production far in excess of rates of carbonate degradation
and thus the budget is positive. This state is consistent with
the rapid vertical growth trajectories exhibited by “keep-up”
or “catch-up” reefs during the Holocene sea-level rise. In
contrast, import-dominated reefs contain a high proportion
of sedimentary material that is often terrigenous in origin.
These reefs also have positive budgets, and good examples
include the reefs described from the inner-shelf areas of the
Great Barrier Reef in Australia (Smithers and Larcombe,
2003), Thailand (Tudhope and Scoffin, 1994) and Mozambique (Perry, 2005). Bioerosion-dominated reefs exhibit
negative budgets with primary and secondary carbonate
production being exceeded by biological substrate degradation. Examples include areas of high carbonate turnover,
such as the non-framebuilding coral communities described
from Oman (Benzoni et al., 2003) and the Red Sea (Riegl
and Piller, 2000). Similar erosion-dominated states may
also arise where non-calcifying groups become dominant
and rates of carbonate production are reduced. A good
example of this has been described from the reefs around
Uva Island, offshore Panama (Eakin, 2001).
Carbonate budgets and long-term rates of reef
framework accumulation
The conceptual budgetary states discussed above provide
a framework for understanding the influence of carbonate
production and erosion processes on reef accretion potential
and framework fabric development at the system scale. In
reality, however, framework types and their production
rates are likely to vary markedly within different reef
sub-environments (reef crest, shallow reef front, reef slope,
etc.) depending upon the composition and abundance of
coral species, species growth rates and, variations in the
types and rates at which different productional and erosional processes operate. Perry (1999) illustrated spatial
variations in the relative importance of these various processes and the resultant framework fabrics across
a fringing reef system in north Jamaica, and these intrareefal variations are also evident in budget assessments
conducted in different areas of individual reef systems
(Eakin, 1996). Over longer (millennial) timescales, these
variations aggregate to determine net framework accumulation rates that are evident in many reef core records. Data
available from many reefs on Australia’s Great Barrier Reef
demonstrate a relatively consistent relationship between
facies type and net long-term accretion rates; highest rates
(> 8 m ka
À1
) occurring in branched coral facies, intermediate rates (typically < 5 m ka
À1
) occurring in head coral
facies, and the slowest rates (< 2 m ka
À1
) occurring within
algal crust facies (Hopley et al., 2007). These datasets also
demonstrate marked changes in framework accretion rates
during different phases of reef growth, with slow net accretion immediately following initiation, highest rates occurring as reefs accreted under rapidly rising sea levels, and
slow or suppressed rates as reefs reach sea level. These variations reflect the carbonate production states and processes
associated with different phases of reef development and
Carbonate Budgets and Reef Framework Accumulation, Figure 1 Schematic illustrating the main production (þve) and
erosional (Àve) processes that determine a reefs carbonate budget.
CARBONATE BUDGETS AND REEF FRAMEWORK ACCUMULATION
187