

Light and Nutrients in the Indian Ocean
55
of the NE monsoon picks up turbid river discharge and transports it all along the east
coast. This results in the waters all along the east coast of India showing uniform transparency under the influence of the prevailing southerly current. In February - April there is
a reversal of the direction of water movement and the waters are of a higher transparency
because the new southerly source is more barren and oceanic in nature. In addition, the
average of the Secchi disk readings taken off Visakhapatnam shows a marked rise from
the months of August through November-December and again a rise to a peak in
30°
N
200~--4---~.---r-~*r~~ct---~~~~~--~V---~--~----T---~--~~
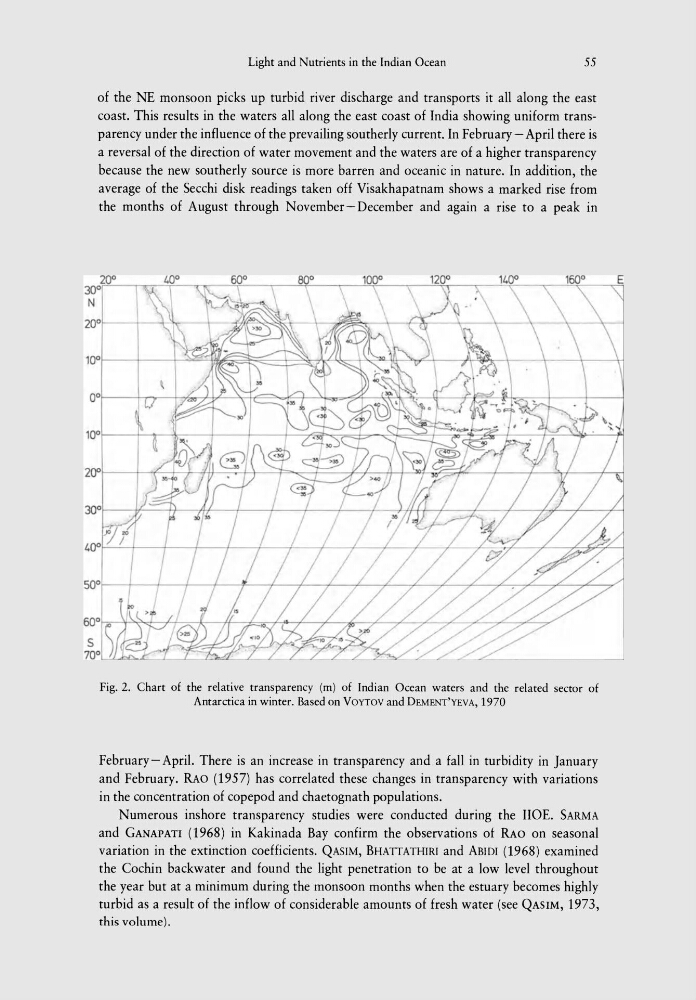
Fig. 2. Chart of the relative transparency (m) of Indian Ocean waters and the related sector of
Antarctica in winter. Based on VOYTOV and DEMENT'YEVA, 1970
February- April. There is an increase in transparency and a fall in turbidity in January
and February. RAo (1957) has correlated these changes in transparency with variations
in the concentration of copepod and chaetognath populations.
Numerous inshore transparency studies were conducted during the HOE. SARMA
and GANAPATI (1968) in Kakinada Bay confirm the observations ot RAo on seasonal
variation in the extinction coefficients. QASIM, BHATTATHIRI and ABIDI (1968) examined
the Cochin backwater and found the light penetration to be at a low level throughout
the year but at a minimum during the monsoon months when the estuary becomes highly
turbid as a result of the inflow of considerable amounts of fresh water (see QASIM, 1973,
this volume).
55
of the NE monsoon picks up turbid river discharge and transports it all along the east
coast. This results in the waters all along the east coast of India showing uniform transparency under the influence of the prevailing southerly current. In February - April there is
a reversal of the direction of water movement and the waters are of a higher transparency
because the new southerly source is more barren and oceanic in nature. In addition, the
average of the Secchi disk readings taken off Visakhapatnam shows a marked rise from
the months of August through November-December and again a rise to a peak in
30°
N
200~--4---~.---r-~*r~~ct---~~~~~--~V---~--~----T---~--~~
Fig. 2. Chart of the relative transparency (m) of Indian Ocean waters and the related sector of
Antarctica in winter. Based on VOYTOV and DEMENT'YEVA, 1970
February- April. There is an increase in transparency and a fall in turbidity in January
and February. RAo (1957) has correlated these changes in transparency with variations
in the concentration of copepod and chaetognath populations.
Numerous inshore transparency studies were conducted during the HOE. SARMA
and GANAPATI (1968) in Kakinada Bay confirm the observations ot RAo on seasonal
variation in the extinction coefficients. QASIM, BHATTATHIRI and ABIDI (1968) examined
the Cochin backwater and found the light penetration to be at a low level throughout
the year but at a minimum during the monsoon months when the estuary becomes highly
turbid as a result of the inflow of considerable amounts of fresh water (see QASIM, 1973,
this volume).