

54
D. A. MCGILL:
of 30 to 35 m is found over the entire open part of the ocean. This agrees with the earlier
observations of JERLOV (1964).
"An extensive region in which relative transparencies above 35 m and even 40 m
predominate corresponds to the central anticyclonic gyre that occupies almost the entire
latitude belt south of 20° S. This region is also plankton poor." (VOYfOV and DEMENT'YEVA, 1970 English trans!' pp. 35). The boundary zone between the Equatorial Current
and the Equatorial Counter Current appears as areas of low (less than 30 m) relative
30"
N
20" f---+---'!-~-+
20"
600 ~-~--~--+-~~~--~--)~-r5
70°L-~~~~~ __ ~MU-.
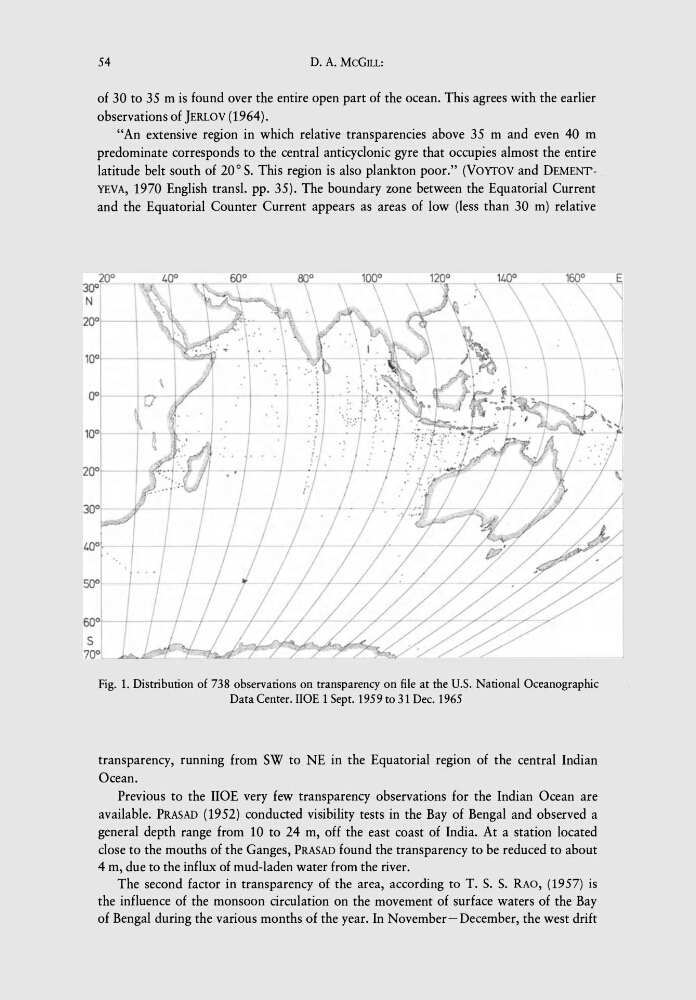
Fig. 1. Distribution of 738 observations on transparency on file at the u.s. National Oceanographic
Data Center. HOE 1 Sept. 1959 to 31 Dec. 1965
transparency, running from SW to NE in the Equatorial region of the central Indian
Ocean.
Previous to the HOE very few transparency observations for the Indian Ocean are
available. PRASAD (1952) conducted visibility tests in the Bay of Bengal and observed a
general depth range from 10 to 24 m, off the east coast of India. At a station located
close to the mouths of the Ganges, PRASAD found the transparency to be reduced to about
4 m, due to the influx of mud-laden water from the river.
The second factor in transparency of the area, according to T. s. s. RAO, (1957) is
the influence of the monsoon circulation on the movement of surface waters of the Bay
of Bengal during the various months of the year. In November- December, the west drift
D. A. MCGILL:
of 30 to 35 m is found over the entire open part of the ocean. This agrees with the earlier
observations of JERLOV (1964).
"An extensive region in which relative transparencies above 35 m and even 40 m
predominate corresponds to the central anticyclonic gyre that occupies almost the entire
latitude belt south of 20° S. This region is also plankton poor." (VOYfOV and DEMENT'YEVA, 1970 English trans!' pp. 35). The boundary zone between the Equatorial Current
and the Equatorial Counter Current appears as areas of low (less than 30 m) relative
30"
N
20" f---+---'!-~-+
20"
600 ~-~--~--+-~~~--~--)~-r5
70°L-~~~~~ __ ~MU-.
Fig. 1. Distribution of 738 observations on transparency on file at the u.s. National Oceanographic
Data Center. HOE 1 Sept. 1959 to 31 Dec. 1965
transparency, running from SW to NE in the Equatorial region of the central Indian
Ocean.
Previous to the HOE very few transparency observations for the Indian Ocean are
available. PRASAD (1952) conducted visibility tests in the Bay of Bengal and observed a
general depth range from 10 to 24 m, off the east coast of India. At a station located
close to the mouths of the Ganges, PRASAD found the transparency to be reduced to about
4 m, due to the influx of mud-laden water from the river.
The second factor in transparency of the area, according to T. s. s. RAO, (1957) is
the influence of the monsoon circulation on the movement of surface waters of the Bay
of Bengal during the various months of the year. In November- December, the west drift