

496
D. J. TRANTER:
as a percentage of the standing stock of phytoplankton carbon. The validity of the comparison depends upon the conversion factors used. The carbon equivalent for micronekton
is derived from VINOGRADOV (1953) who found little variation from one fish to another.
The carbon equivalent for zooplankton was determined directly on representative samples
from each cruise, by NEWELL. The carbon equivalent for chlorophyll a lies within the
range of values usually recommended (HAGMEIER, 1961; RYTHER and MENZEL, 1965;
EpPLEY, 1968; ZEITZSCHEL, 1970). To have used a higher value for the (oligotrophic)
subtropical zone and a lower value for the (more eutrophic) tropical zone, in line with
EpPLEY's recommendations, would have accentuated the existing difference between the
2 zones, but may nevertheless have been justified.
The Table shows that there was from 2 to 3 times as much detrital carbon in the
water as living phytoplankton carbon. Zooplankton carbon ranged from 17 to 73 % of
phytoplankton carbon, the ratio generally being higher in the tropics (mean, 55%) than in
the subtropics (mean, 43%). Micronekton carbon ranged from 1.6 to 6.7% of phytoplankton carbon. The daily primary production measured by the simulated in situ
technique ranged from 10 to 34% of the phytoplankton standing stock in the tropics
(turnover, 3 -10 days), and from 10 to 15% in the sub tropics (turnover, 6 -10 days).
These are surprising values, particularly the low level of detrital carbon and high level of
zooplankton carbon, relative to phytoplankton carbon; in the Sargasso Sea, for example,
zooplankton carbon is only 15% of phytoplankton carbon (BEERS, 1966). The significance
of these ratios in relation to energy transfer is dealt with in the discussion.
MEAN SEASONAL AMPLITUDE (%)
0
20
40
00
80
100%
EUCHAETA MEDIA
~
EUCIlAETA MARINA
')
EUCALANUS ATTENUATUS
~
EUCIlAETA LONGICORNIS
~
RHINCALANUS CORNUTUS
~
SPECIES
EUCALANUS SUBTENUIS
~
EUCALANUS PILEATUS
')
EUCHAETA WOLFENDENI
')
I
EUCALANUS MUCRONATUS
I~
EUCALANUS SUBCRASSUS
I~
EUCIlAETA CONCINNA
I~
RHINCALANUS NASUTUS
I~
FISB EGGS AND LARVAE
')
COPELATA
)
'llIALIACEAE
)
TAXA
COELENTERATA
')
DECAPOD LARVAE
)
OSTRACODA
)
CHAETOGNA TRA
')
COPEPODA
)
ZOOPLANKTON
)
HWT TOTAL
)
ZOOPLANKTON
')
BIOMASS
MACRO PLANKTON
)
HI CRONEXTON
)
PRIMARY PRODUCTIVIty
')
CHLOROPHYLL a
)
CHLOROPHYLL ' £
)
INORGANI C NITRATE
')
NUTRIENTS INORGANIC PHOSPHATE ~
ANNUA MEAN
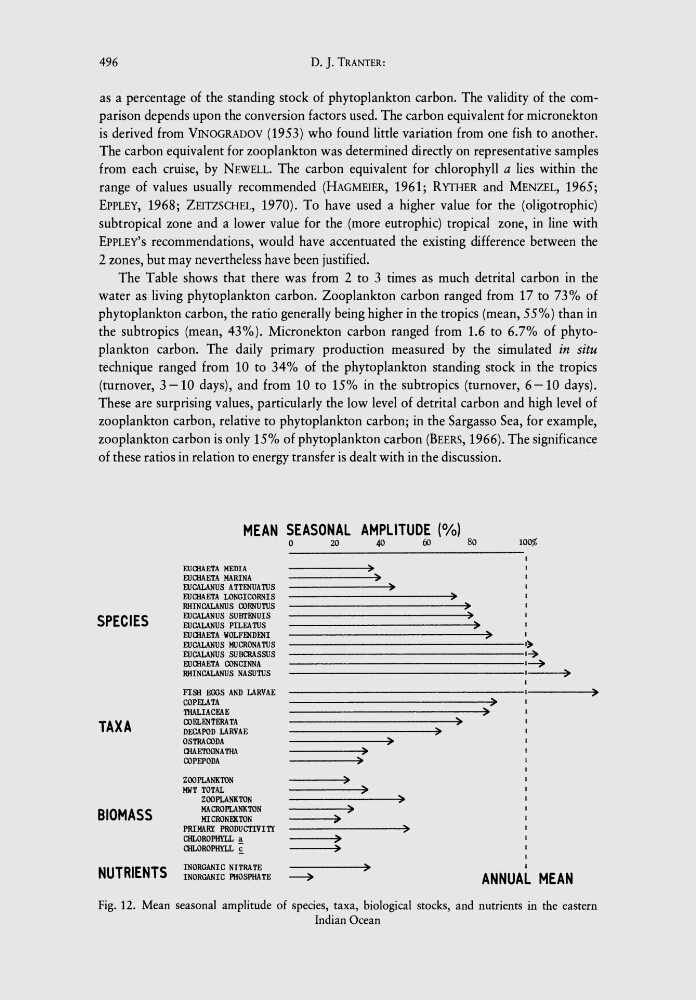
Fig. 12. Mean seasonal amplitude of species, taxa, biological stocks, and nutrients in the eastern
Indian Ocean
D. J. TRANTER:
as a percentage of the standing stock of phytoplankton carbon. The validity of the comparison depends upon the conversion factors used. The carbon equivalent for micronekton
is derived from VINOGRADOV (1953) who found little variation from one fish to another.
The carbon equivalent for zooplankton was determined directly on representative samples
from each cruise, by NEWELL. The carbon equivalent for chlorophyll a lies within the
range of values usually recommended (HAGMEIER, 1961; RYTHER and MENZEL, 1965;
EpPLEY, 1968; ZEITZSCHEL, 1970). To have used a higher value for the (oligotrophic)
subtropical zone and a lower value for the (more eutrophic) tropical zone, in line with
EpPLEY's recommendations, would have accentuated the existing difference between the
2 zones, but may nevertheless have been justified.
The Table shows that there was from 2 to 3 times as much detrital carbon in the
water as living phytoplankton carbon. Zooplankton carbon ranged from 17 to 73 % of
phytoplankton carbon, the ratio generally being higher in the tropics (mean, 55%) than in
the subtropics (mean, 43%). Micronekton carbon ranged from 1.6 to 6.7% of phytoplankton carbon. The daily primary production measured by the simulated in situ
technique ranged from 10 to 34% of the phytoplankton standing stock in the tropics
(turnover, 3 -10 days), and from 10 to 15% in the sub tropics (turnover, 6 -10 days).
These are surprising values, particularly the low level of detrital carbon and high level of
zooplankton carbon, relative to phytoplankton carbon; in the Sargasso Sea, for example,
zooplankton carbon is only 15% of phytoplankton carbon (BEERS, 1966). The significance
of these ratios in relation to energy transfer is dealt with in the discussion.
MEAN SEASONAL AMPLITUDE (%)
0
20
40
00
80
100%
EUCHAETA MEDIA
~
EUCIlAETA MARINA
')
EUCALANUS ATTENUATUS
~
EUCIlAETA LONGICORNIS
~
RHINCALANUS CORNUTUS
~
SPECIES
EUCALANUS SUBTENUIS
~
EUCALANUS PILEATUS
')
EUCHAETA WOLFENDENI
')
I
EUCALANUS MUCRONATUS
I~
EUCALANUS SUBCRASSUS
I~
EUCIlAETA CONCINNA
I~
RHINCALANUS NASUTUS
I~
FISB EGGS AND LARVAE
')
COPELATA
)
'llIALIACEAE
)
TAXA
COELENTERATA
')
DECAPOD LARVAE
)
OSTRACODA
)
CHAETOGNA TRA
')
COPEPODA
)
ZOOPLANKTON
)
HWT TOTAL
)
ZOOPLANKTON
')
BIOMASS
MACRO PLANKTON
)
HI CRONEXTON
)
PRIMARY PRODUCTIVIty
')
CHLOROPHYLL a
)
CHLOROPHYLL ' £
)
INORGANI C NITRATE
')
NUTRIENTS INORGANIC PHOSPHATE ~
ANNUA MEAN
Fig. 12. Mean seasonal amplitude of species, taxa, biological stocks, and nutrients in the eastern
Indian Ocean