

4.12
Distribution and Abundance of Planktonic Amphipods
in the Indian Ocean
K. K. C. NAIR, P. G. JACOB, and S. KUMARAN
This report is to our knowledge the first to describe the quantitative and qualitative
distribution of amphipods in the Indian Ocean, with special emphasis on the dominance
of various families within the sub-order. Detailed studies at the species level are in
progress.
I. Material and Methods
The data presented here arise from the basic sorting and subsorting of the HOE samples
carried out at the Indian Ocean Biological Centre (IOBC). Out of 1927 samples processed
(IOBC Handbook 1,1969), only 1548 standard samples have been taken into account in
preparing the figures.
The year is divided into 2 periods: April 16 - October 15 SW monsoon and October
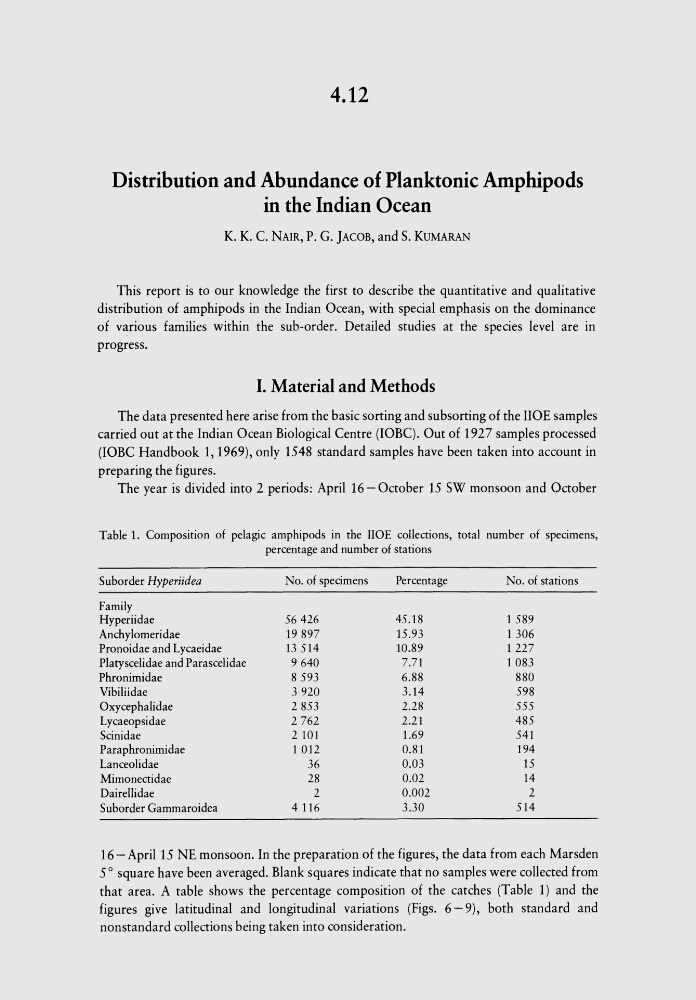
Table 1. Composition of pelagic amphipods in the IIOE collections, total number of specimens,
percentage and number of stations
Suborder Hyperiidea
No. of specimens
Percentage
No. of stations
Family
Hyperiidae
56426
45.18
1589
Anchylomeridae
19897
15.93
1306
Pronoidae and Lycaeidae
13 514
10.89
1227
Platyscelidae and Parascelidae
9640
7.71
1083
Phronimidae
8593
6.88
880
Vibiliidae
3920
3.14
598
Oxycephalidae
2853
2.28
555
Lycaeopsidae
2762
2.21
485
Scinidae
2101
1.69
541
Paraphronimidae
1012
0.81
194
Lanceolidae
36
0.03
15
Mimonectidae
28
0.02
14
Dairellidae
2
0.002
2
Suborder Gammaroidea
4116
3.30
514
16 - April 15 NE monsoon. In the preparation of the figures, the data from each Marsden
50 square have been averaged. Blank squares indicate that no samples were collected from
that area. A table shows the percentage composition of the catches (Table 1) and the
figures give latitudinal and longitudinal variations (Figs. 6 - 9), both standard and
nonstandard collections being taken into consideration.
Distribution and Abundance of Planktonic Amphipods
in the Indian Ocean
K. K. C. NAIR, P. G. JACOB, and S. KUMARAN
This report is to our knowledge the first to describe the quantitative and qualitative
distribution of amphipods in the Indian Ocean, with special emphasis on the dominance
of various families within the sub-order. Detailed studies at the species level are in
progress.
I. Material and Methods
The data presented here arise from the basic sorting and subsorting of the HOE samples
carried out at the Indian Ocean Biological Centre (IOBC). Out of 1927 samples processed
(IOBC Handbook 1,1969), only 1548 standard samples have been taken into account in
preparing the figures.
The year is divided into 2 periods: April 16 - October 15 SW monsoon and October
Table 1. Composition of pelagic amphipods in the IIOE collections, total number of specimens,
percentage and number of stations
Suborder Hyperiidea
No. of specimens
Percentage
No. of stations
Family
Hyperiidae
56426
45.18
1589
Anchylomeridae
19897
15.93
1306
Pronoidae and Lycaeidae
13 514
10.89
1227
Platyscelidae and Parascelidae
9640
7.71
1083
Phronimidae
8593
6.88
880
Vibiliidae
3920
3.14
598
Oxycephalidae
2853
2.28
555
Lycaeopsidae
2762
2.21
485
Scinidae
2101
1.69
541
Paraphronimidae
1012
0.81
194
Lanceolidae
36
0.03
15
Mimonectidae
28
0.02
14
Dairellidae
2
0.002
2
Suborder Gammaroidea
4116
3.30
514
16 - April 15 NE monsoon. In the preparation of the figures, the data from each Marsden
50 square have been averaged. Blank squares indicate that no samples were collected from
that area. A table shows the percentage composition of the catches (Table 1) and the
figures give latitudinal and longitudinal variations (Figs. 6 - 9), both standard and
nonstandard collections being taken into consideration.